

Ferrari won the 24 Hours of Le Mans 2025 at Circuit de la Sarthe. The #83 Ferrari 499P of Ferrari AF Corse covered 387 laps over 24h 03m, a race distance of 5,273 km. The winning crew: Robert Kubica, Yifei Ye and Philip Hanson. The margin to second place was 14.1 s, close enough to keep the result open late. The fastest manufacturer also produced the winner.
How the Lead Was Won
Across the race we counted 10 lead changes among 5 different cars in the HYPERCAR class. At the closest point, first and second were only 1.2 s apart. For 19 of 24 measured hours the gap stayed under 30 seconds.
That is a real head-to-head fight, not a comfortable lead.
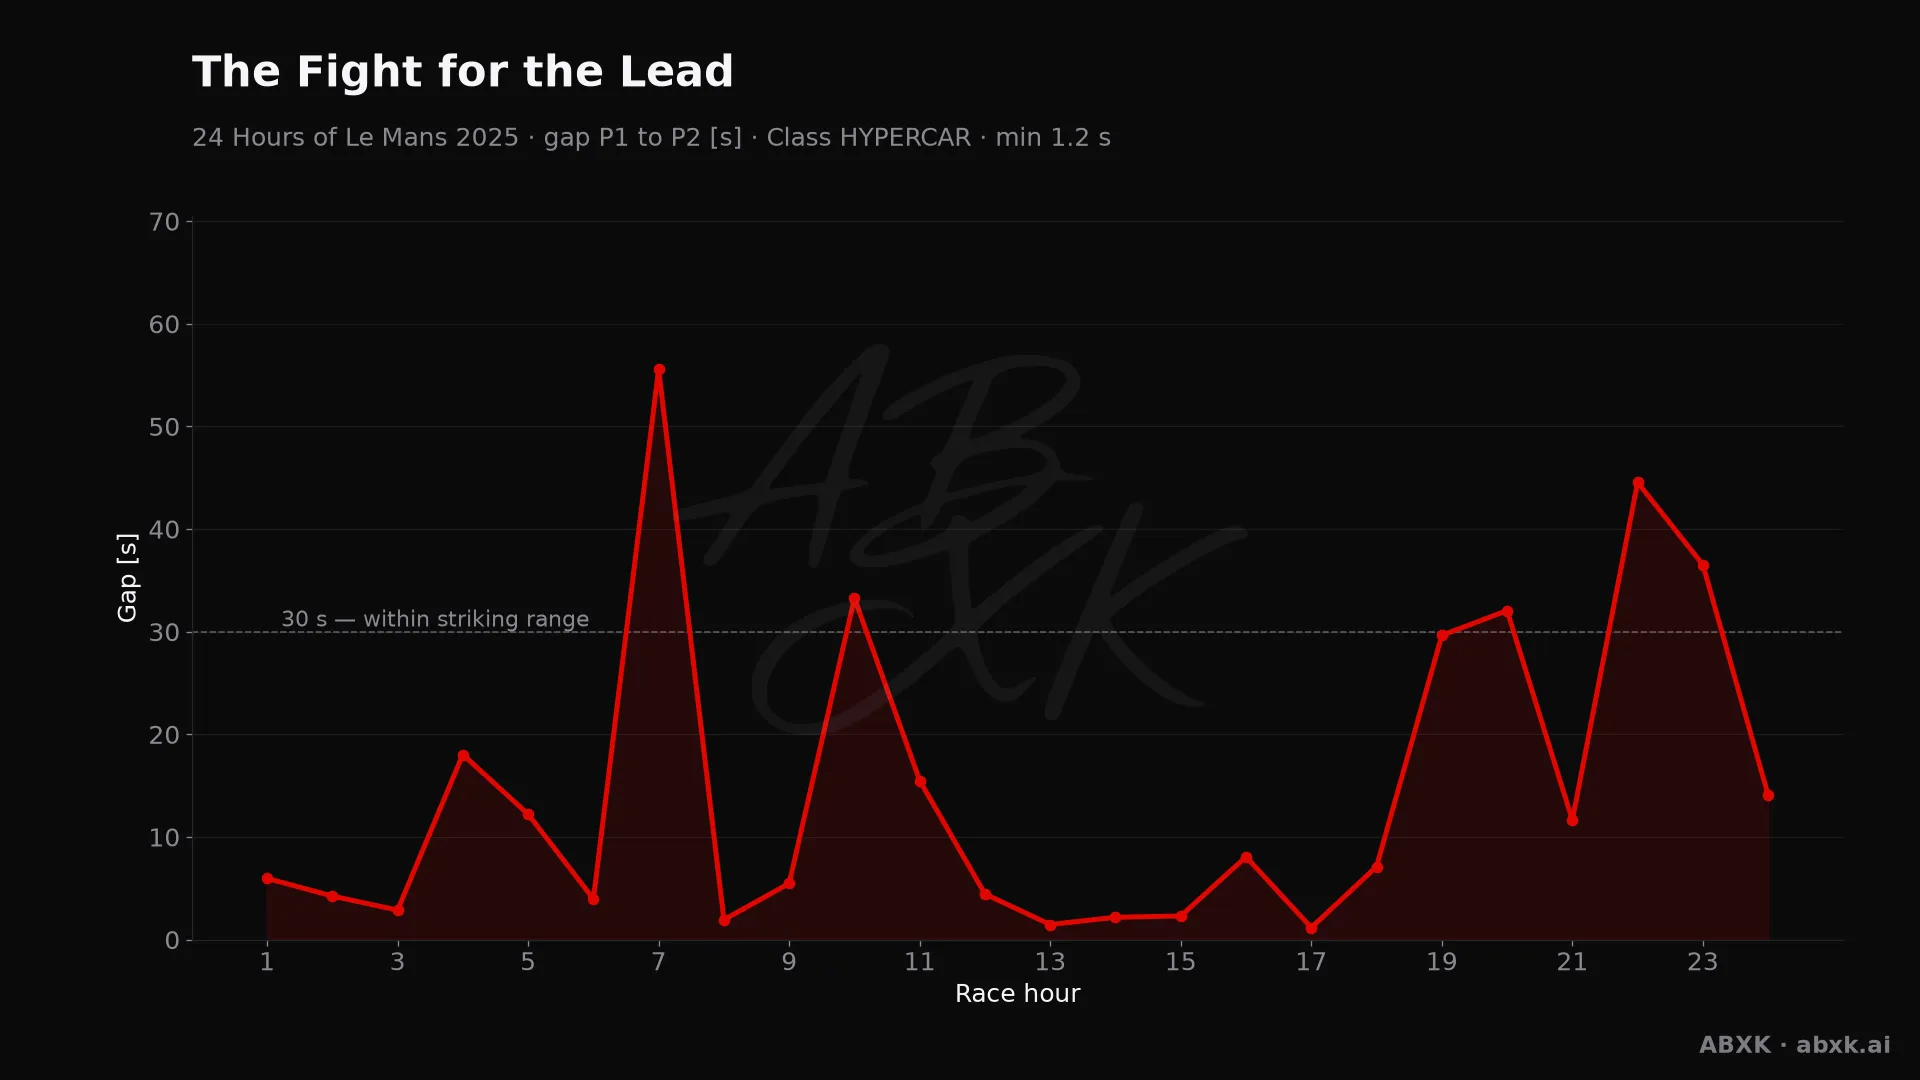
Figure 1 shows how that gap moved over the distance.
Manufacturer Pace
We rank pace by the average of each manufacturer’s fastest lap. That measures real speed over the distance instead of one lucky lap. The order at the top: Ferrari (237.3 km/h), BMW (237.2 km/h), Porsche (236.8 km/h).
Between the fastest and the slowest manufacturer in the HYPERCAR class lie 2.7 km/h. That is a wide spread. At this track, the concept differences show clearly.
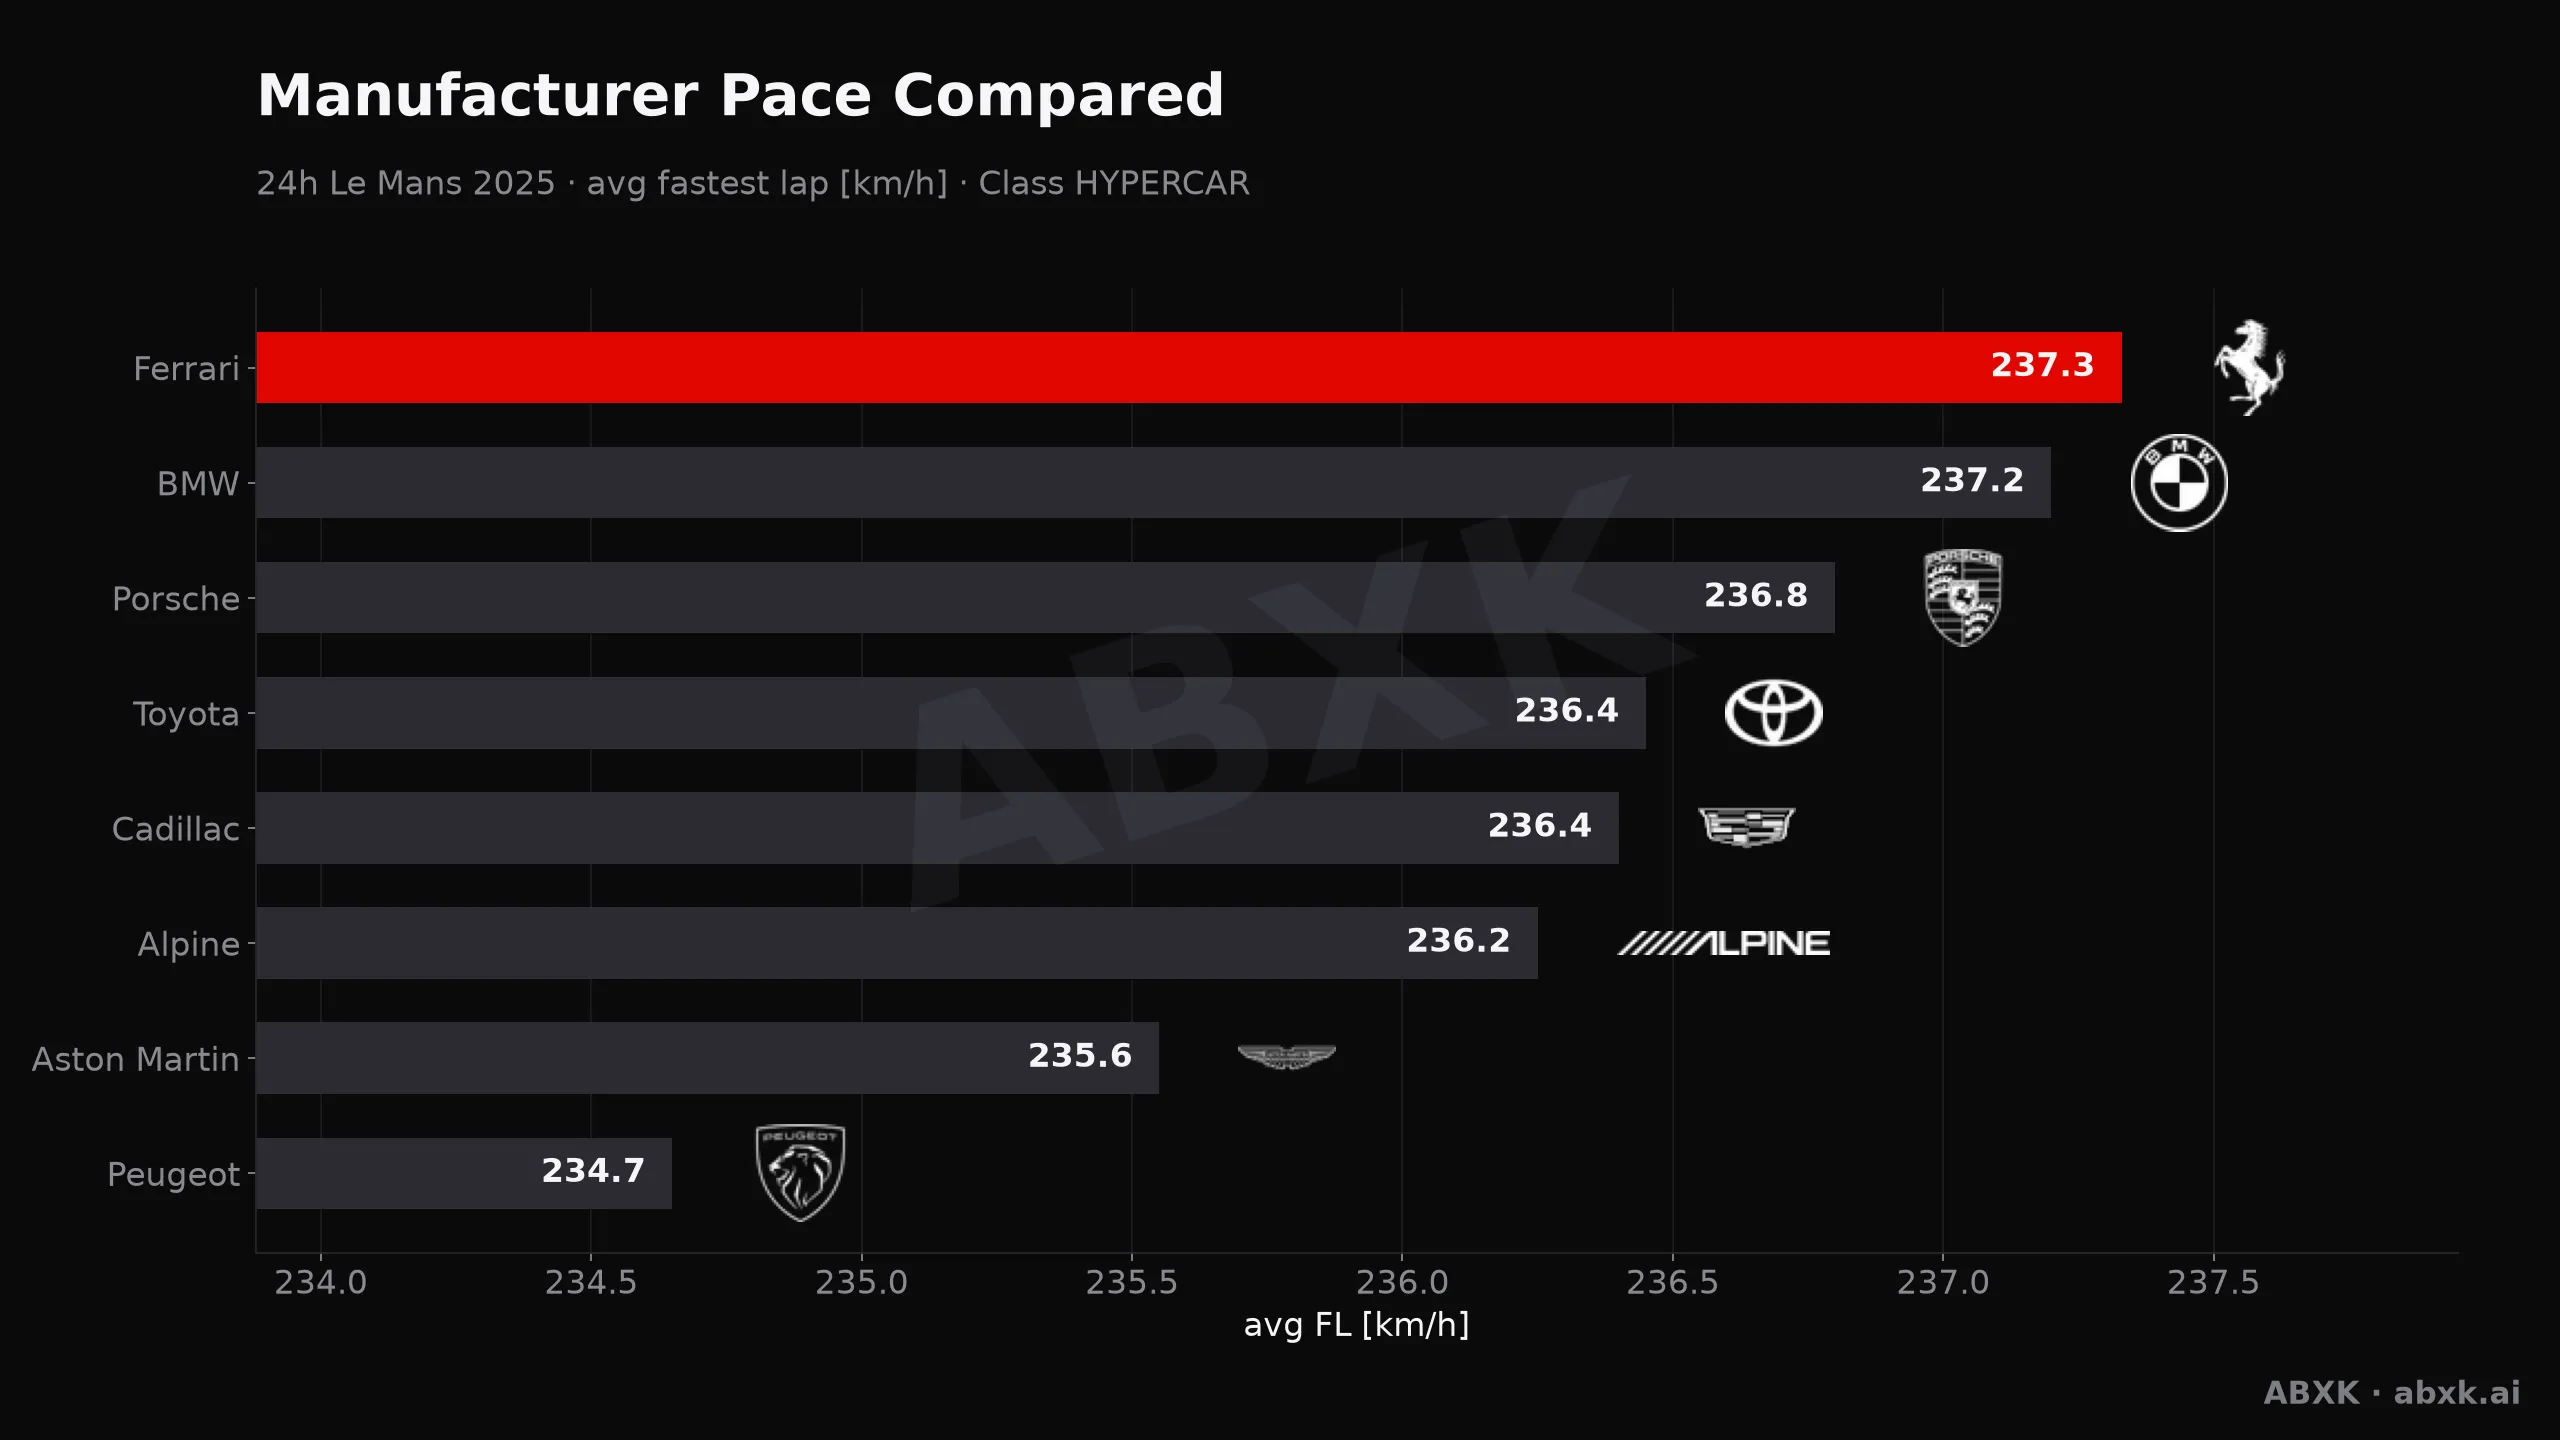
Figure 2 sets the pace order side by side.
Reliability by Class
14 of 62 cars did not make the finish — an overall retirement rate of 23%. The heaviest toll fell on LMGT3 with 33%, while HYPERCAR came through best at 14%.
Over this distance, reliability is a result in itself. A car that stops scores nothing, no matter how fast it was.
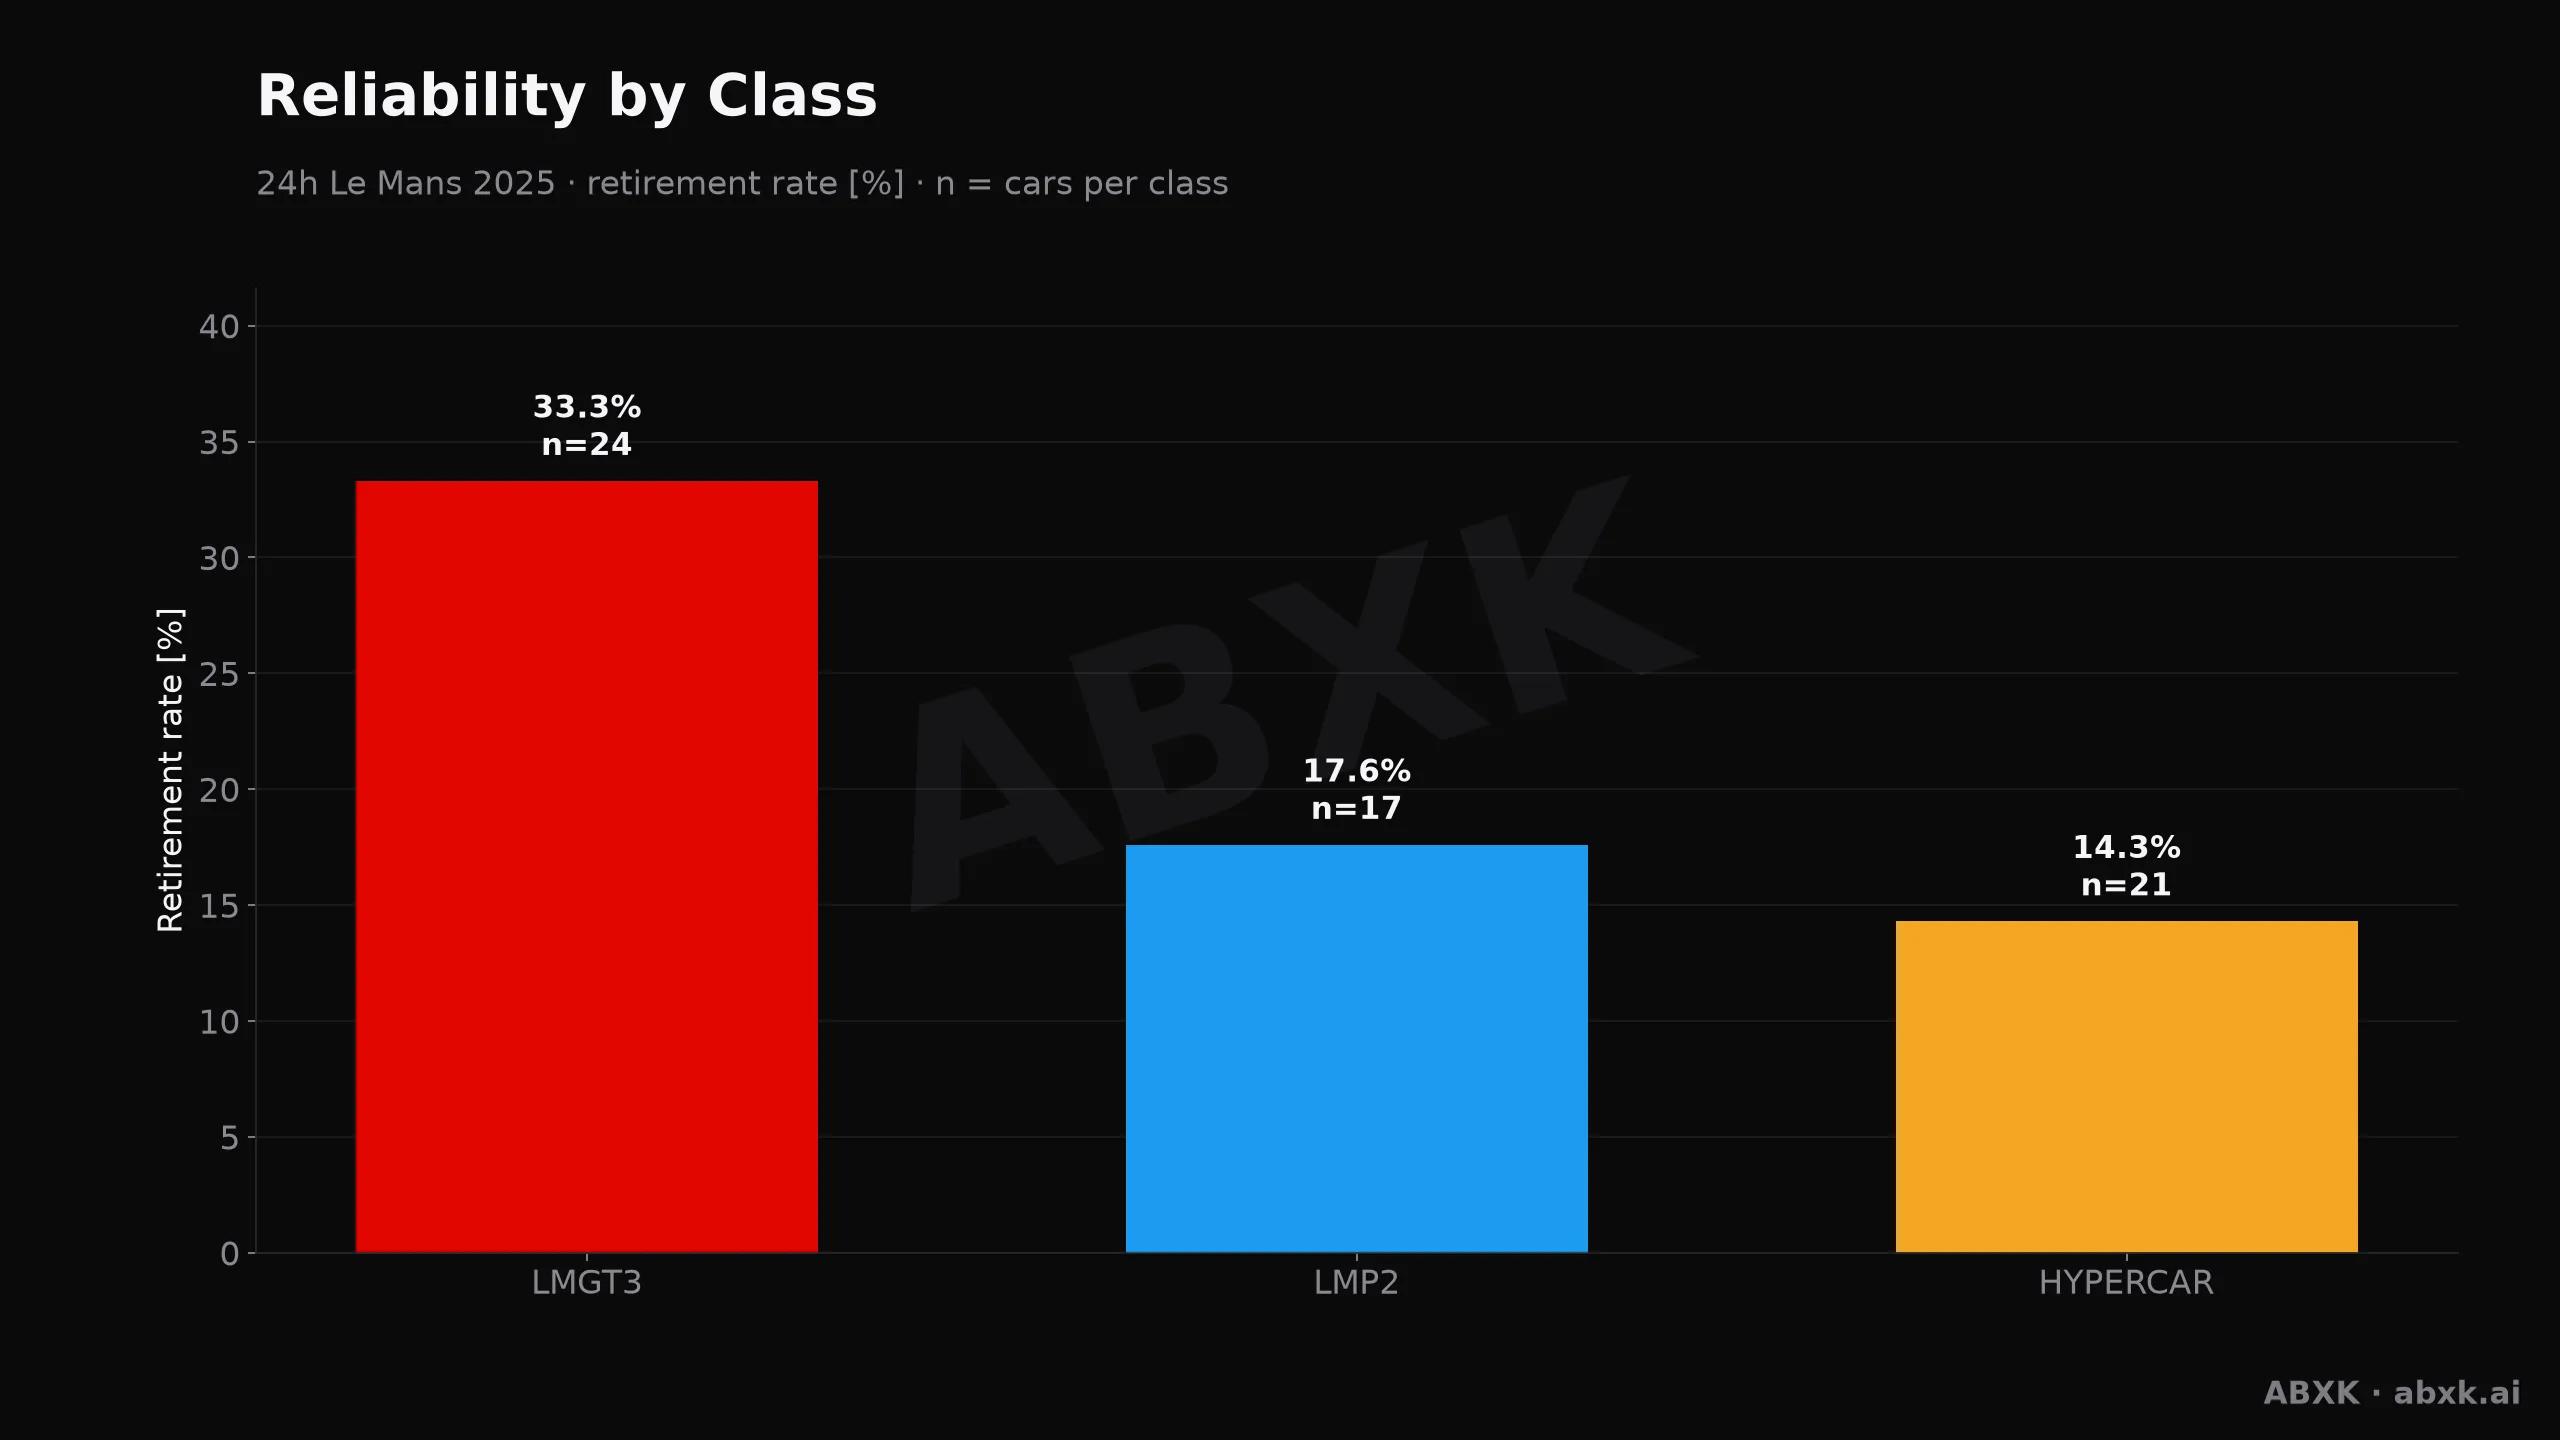
Figure 3 compares the classes directly.
Efficiency Over the Distance
Our efficiency score multiplies average lap speed by laps completed and compares that to the class average. It rewards cars that were fast and stayed out of trouble. A value of 1.000 is exactly class average.
The top score goes to #83 Ferrari with 1.059. That is the winning car — speed and durability came from the same package.
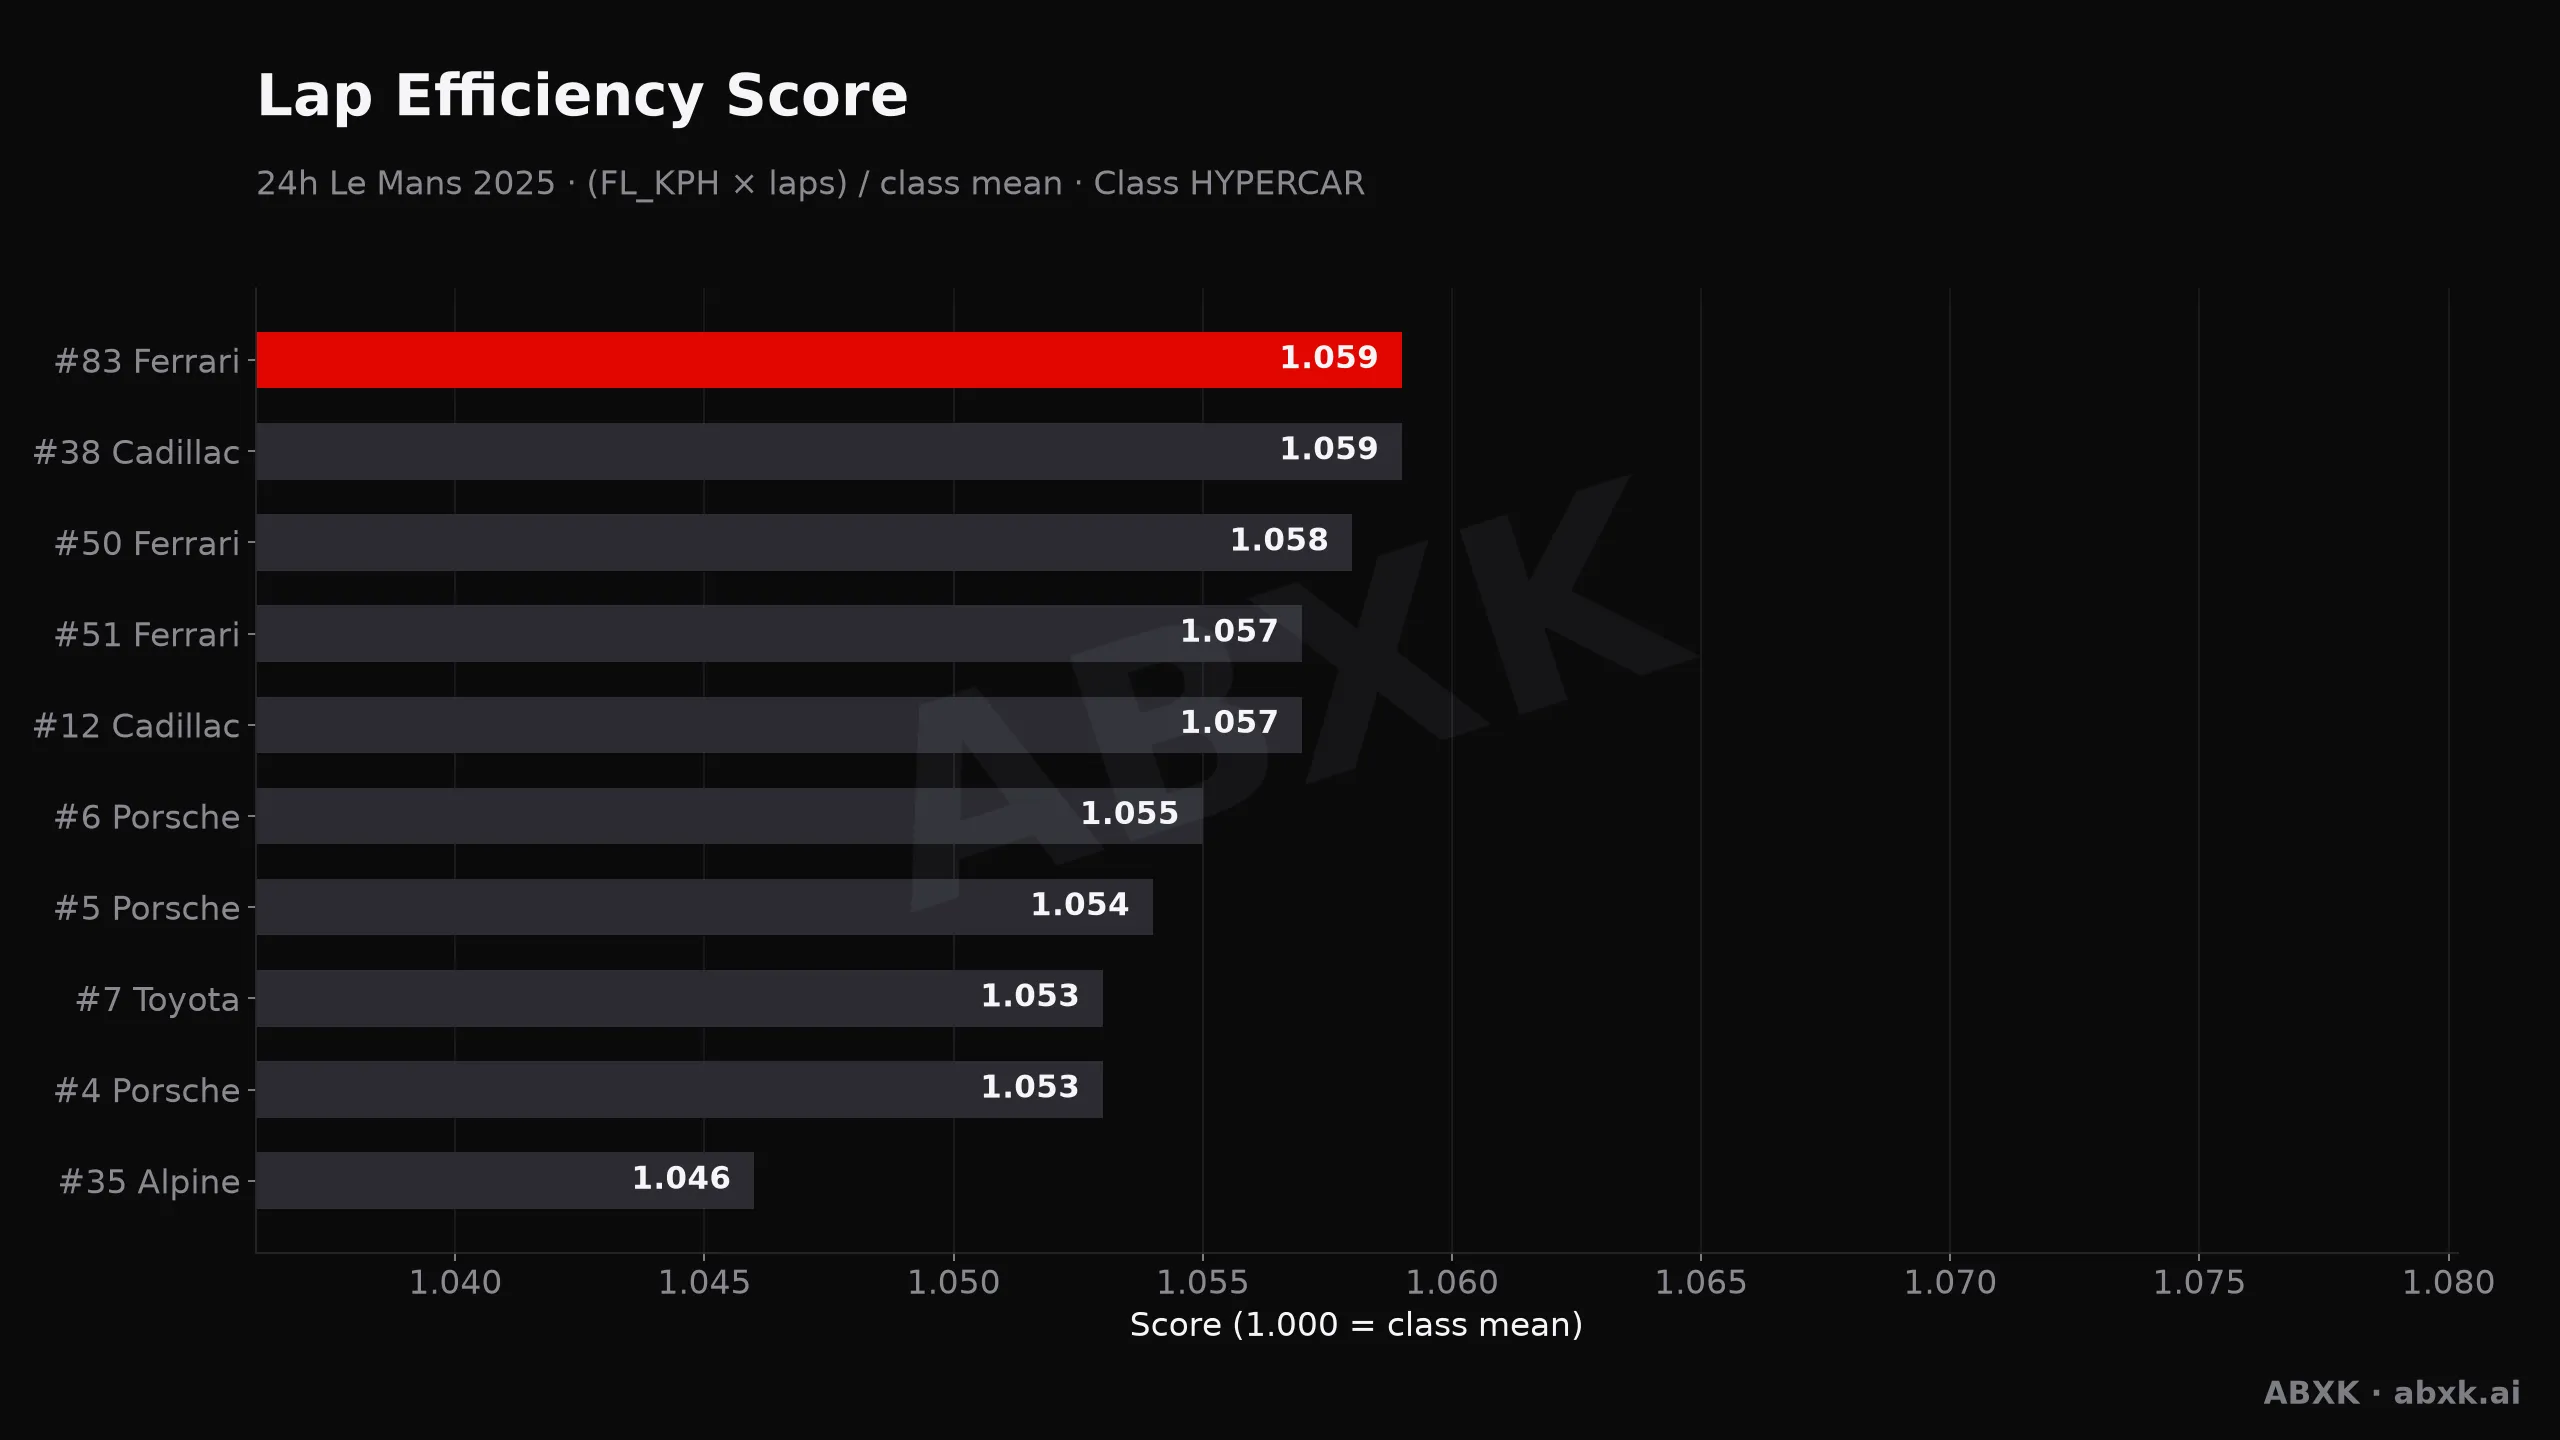
Figure 4 ranks the cars by that score.
Night Versus Day
Top-class cars averaged 235.5 km/h in daylight and 235.4 km/h at night. The difference is 0.12 km/h — faster in daylight.
In other words: no measurable night effect. Darkness costs concentration and makes traffic harder to read, but it does not slow modern prototypes down.
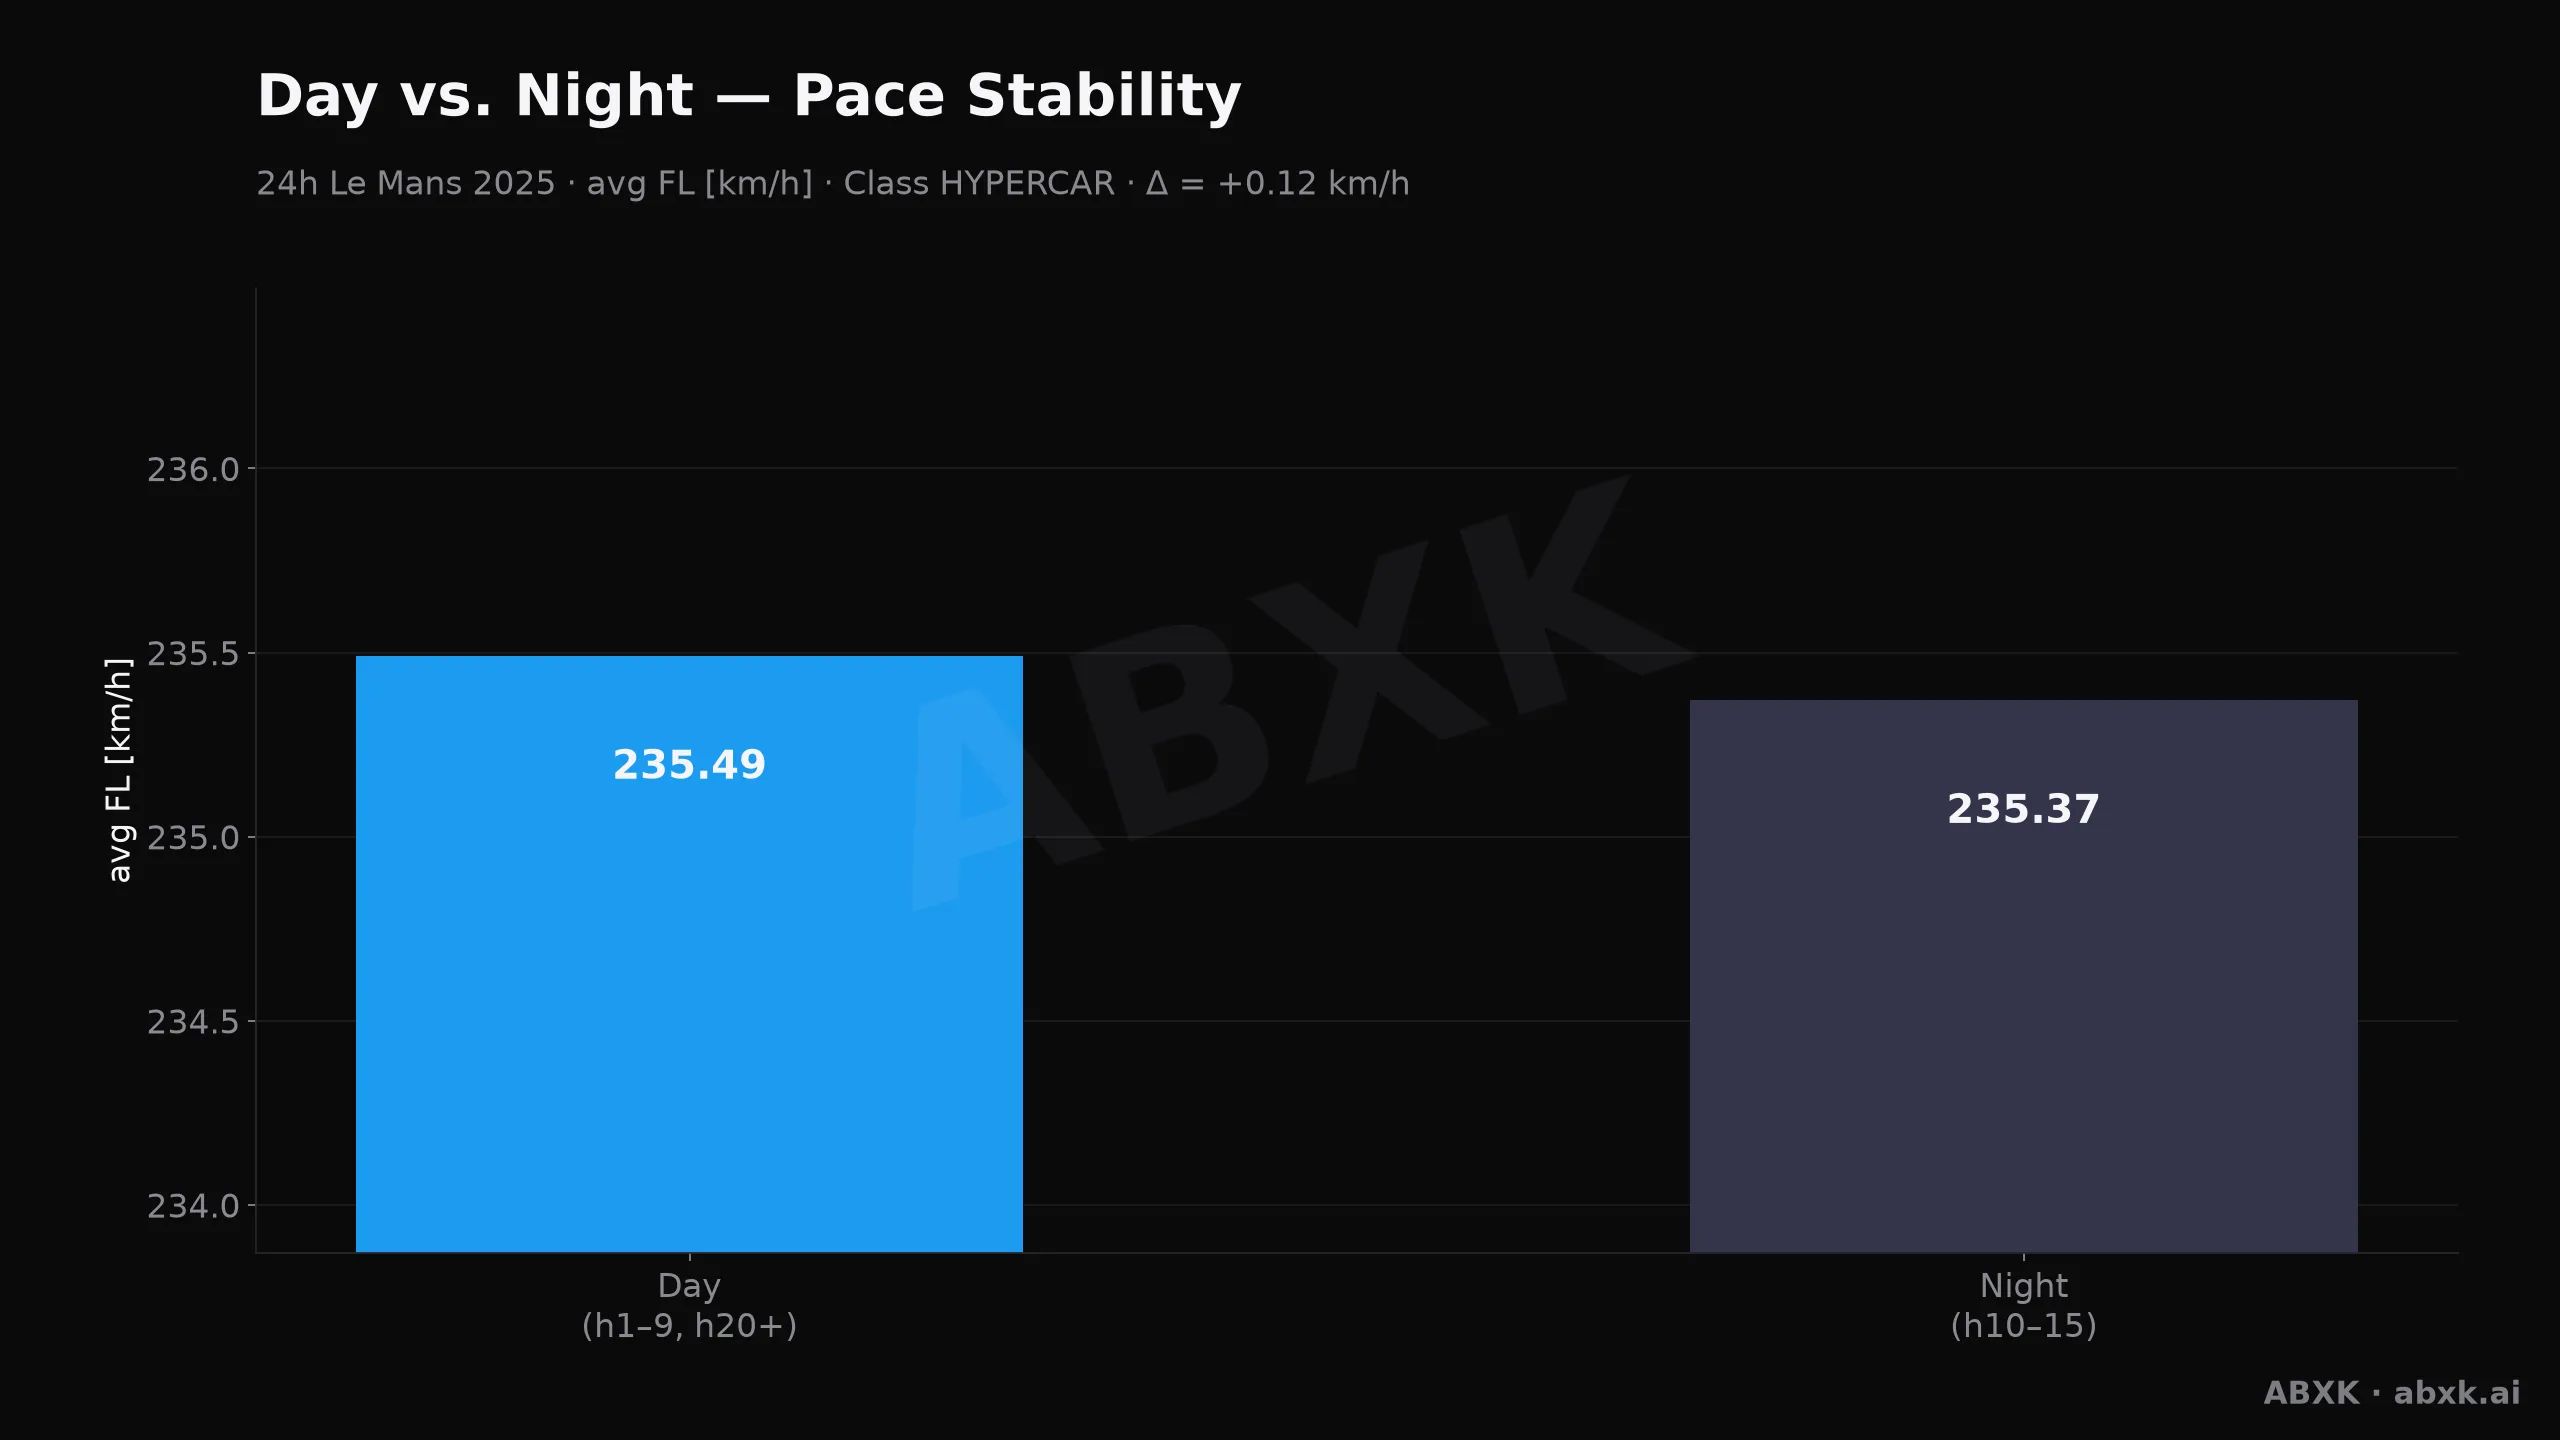
Figure 5 puts both phases next to each other.
The Closing Phase
In the final hour, 77% of the field held position within ±1 place (n = 62). Most of the order was set, but a few fights ran to the end. The biggest single move came from #50 Ferrari, 59 places back.
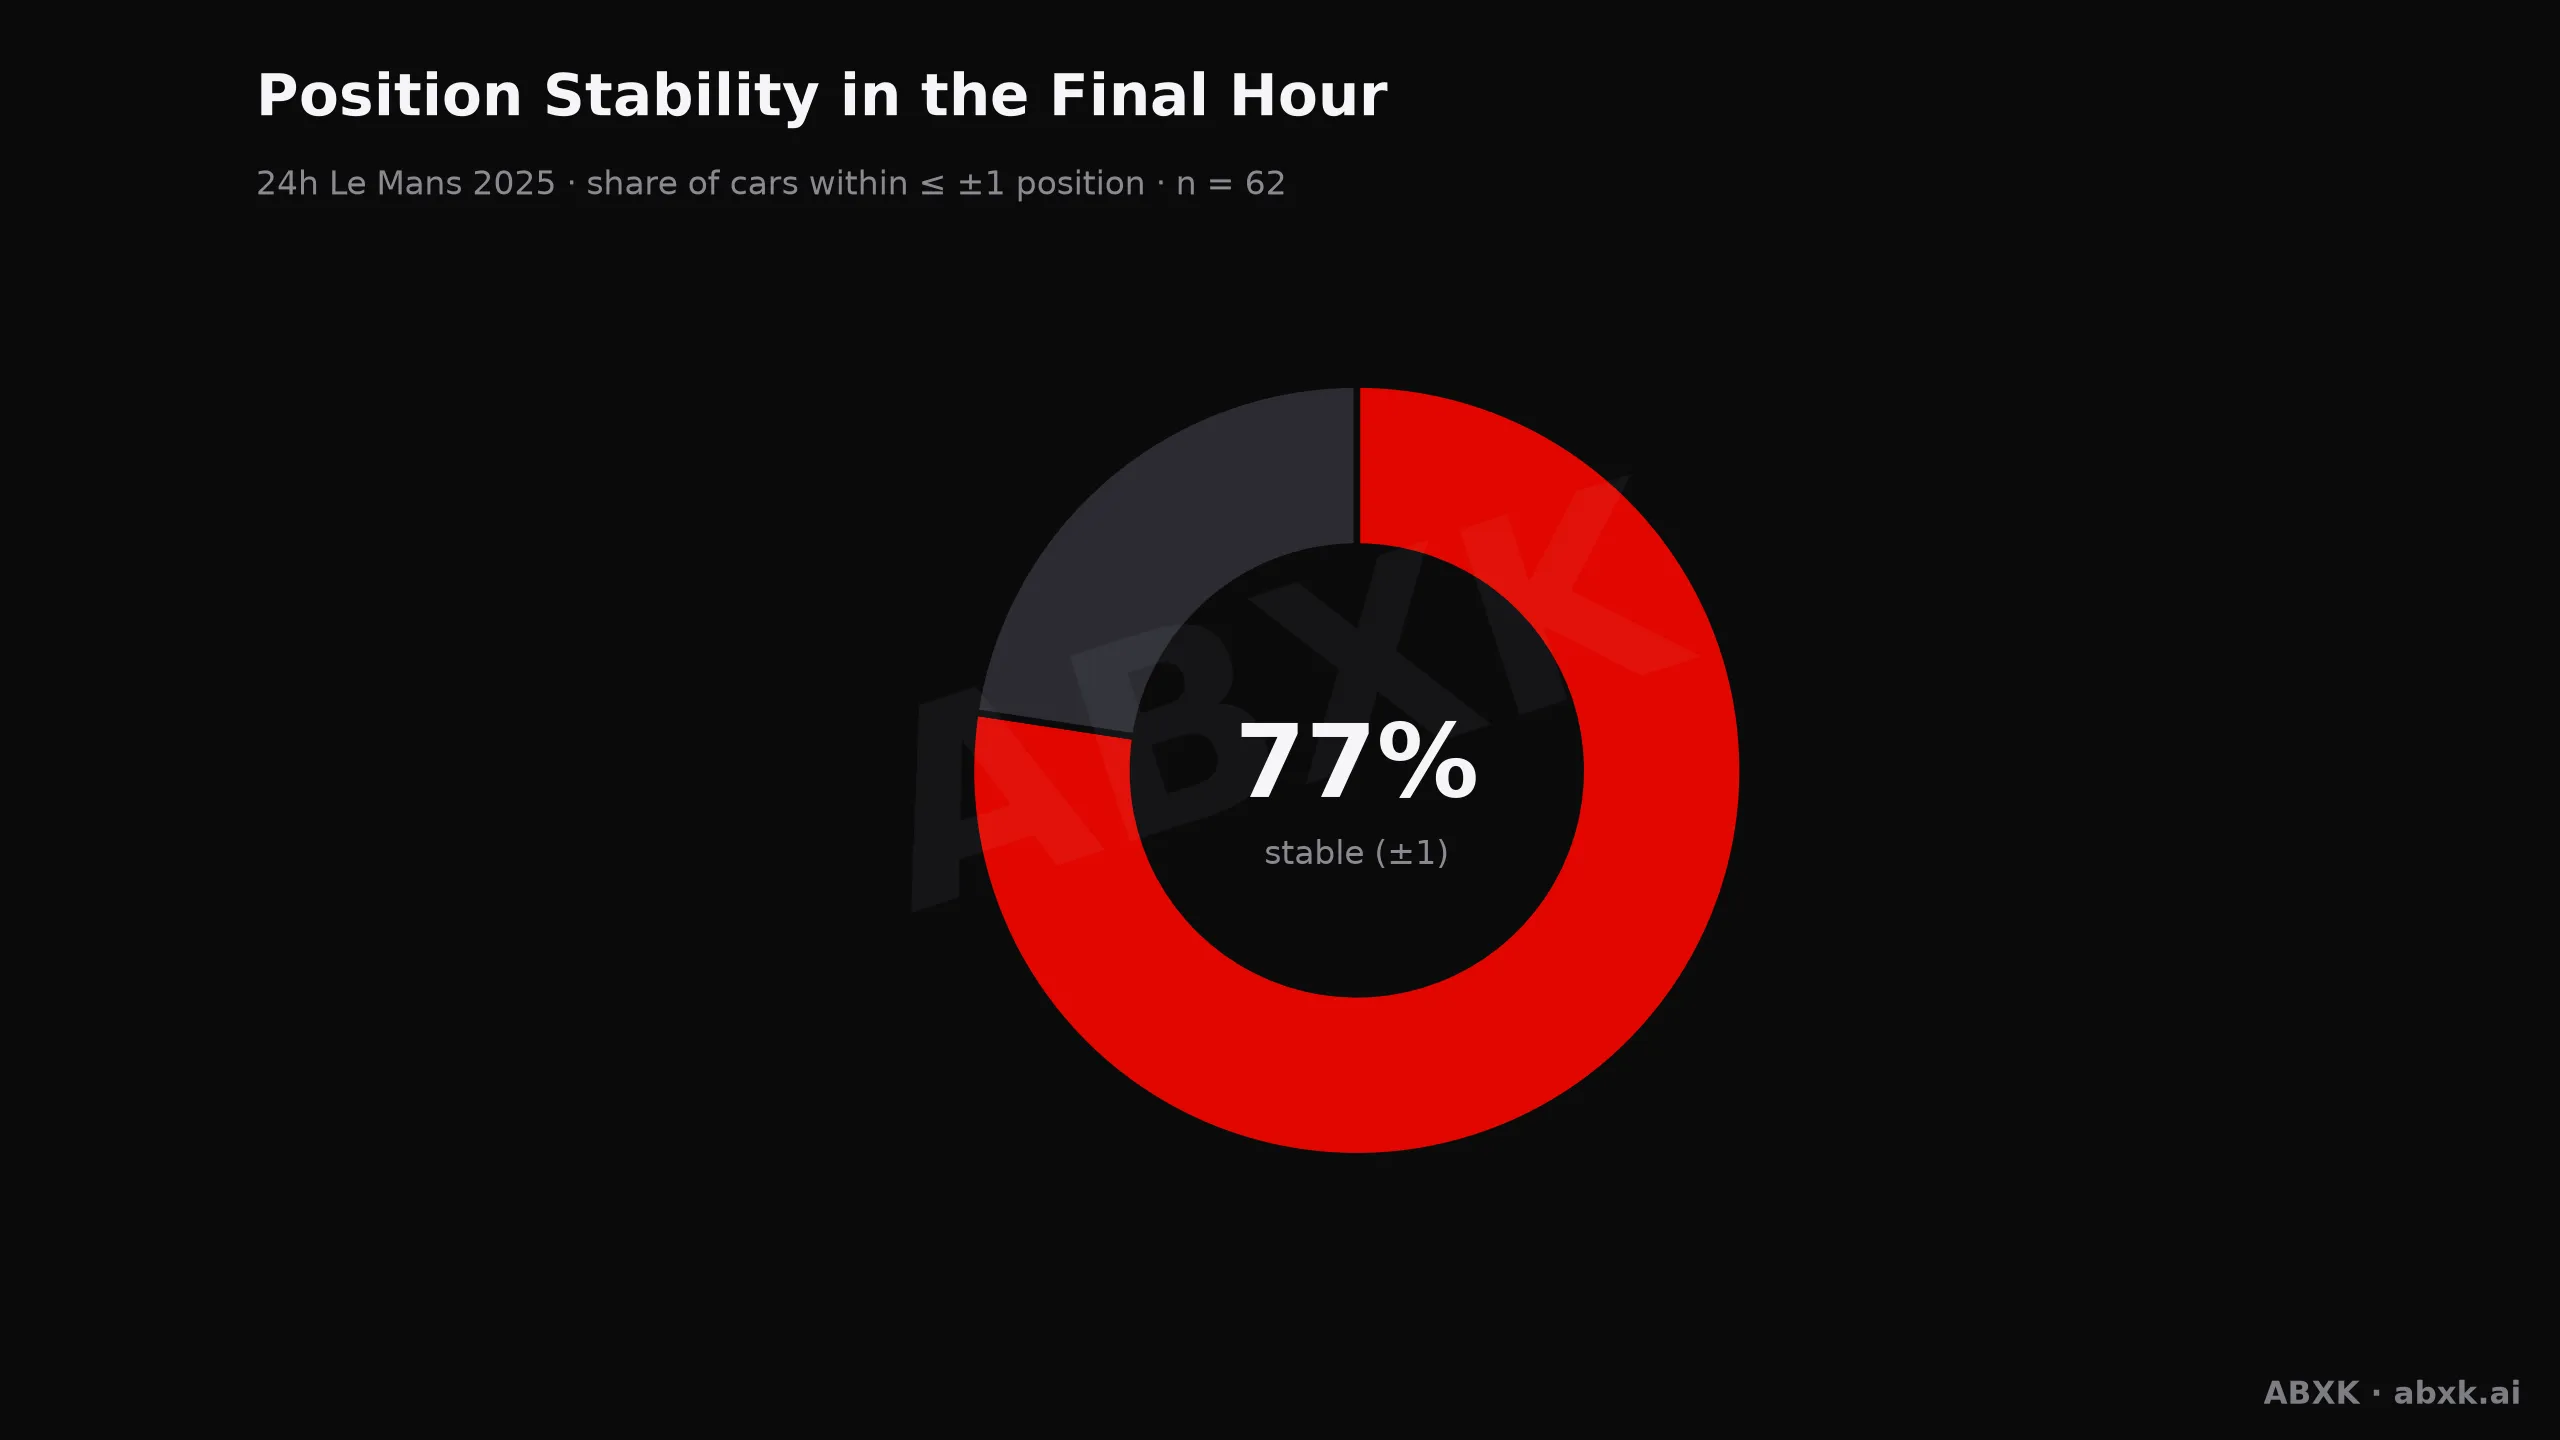
Figure 6 shows how settled the finish really was.
Fastest Lap and Class Gaps
The fastest single lap of the race belongs to #38 Cadillac (Hertz Team JOTA): 3:26.063 at 238.1 km/h. Crew: Earl Bamber, Sébastien Bourdais and Jenson Button.
Between HYPERCAR and LMP2 sits a pace gap of 9.8 s per lap. That number decides how much traffic the leaders have to work through.
Class winners — HYPERCAR: #83 Ferrari (Ferrari AF Corse), LMP2: #43 Oreca (Inter Europol Competition), LMGT3: #92 Porsche (Manthey).
Putting the Race in Context
The winner averaged 219.3 km/h across 5,273 km. On a 13.626 km lap, that is the pace the whole strategy had to sustain.
We calculate the same metrics for every race in the archive: pace order, reliability by class, lead changes, winning margin, closing stability and efficiency. That makes this race directly comparable with every other round of the 2025 season — and with the seasons before it.
All figures are derived from the full classification of every race hour and are recalculated with each build.





