
Motorsport Data & AI · Rolex 24 At Daytona 2026 · Season 2026

Rolex 24 At Daytona 2026 — AI Data Analysis

Porsche wins the Rolex 24 At Daytona 2026 with the #7 Porsche 963. Pace order, reliability by class, lead changes and the closing phase in a data check.

#7Winner · Porsche
705Laps led
60Cars total
23 hanalyzed

Winning crew · #7 Porsche Penske MotorsportFelipe Nasr · Julien Andlauer · Laurin Heinrich

Porsche won the Rolex 24 At Daytona 2026 at Daytona International Speedway. The #7 Porsche 963 of Porsche Penske Motorsport covered 705 laps over 24 hours, a race distance of 4,039 km. The winning crew: Felipe Nasr, Julien Andlauer and Laurin Heinrich. The margin to second place was just 1.569 s — a sprint finish after a full endurance race. The fastest manufacturer also produced the winner.

How the Lead Was Won

Across the race we counted 15 lead changes among 6 different cars in the GTP class.

Manufacturer Pace

We rank pace by the average of each manufacturer’s fastest lap. That measures real speed over the distance instead of one lucky lap. The order at the top: Porsche (214.1 km/h), Cadillac (214.1 km/h), Acura (214.0 km/h).

Between the fastest and the slowest manufacturer in the GTP class lie 3.2 km/h. That is a wide spread. At this track, the concept differences show clearly.
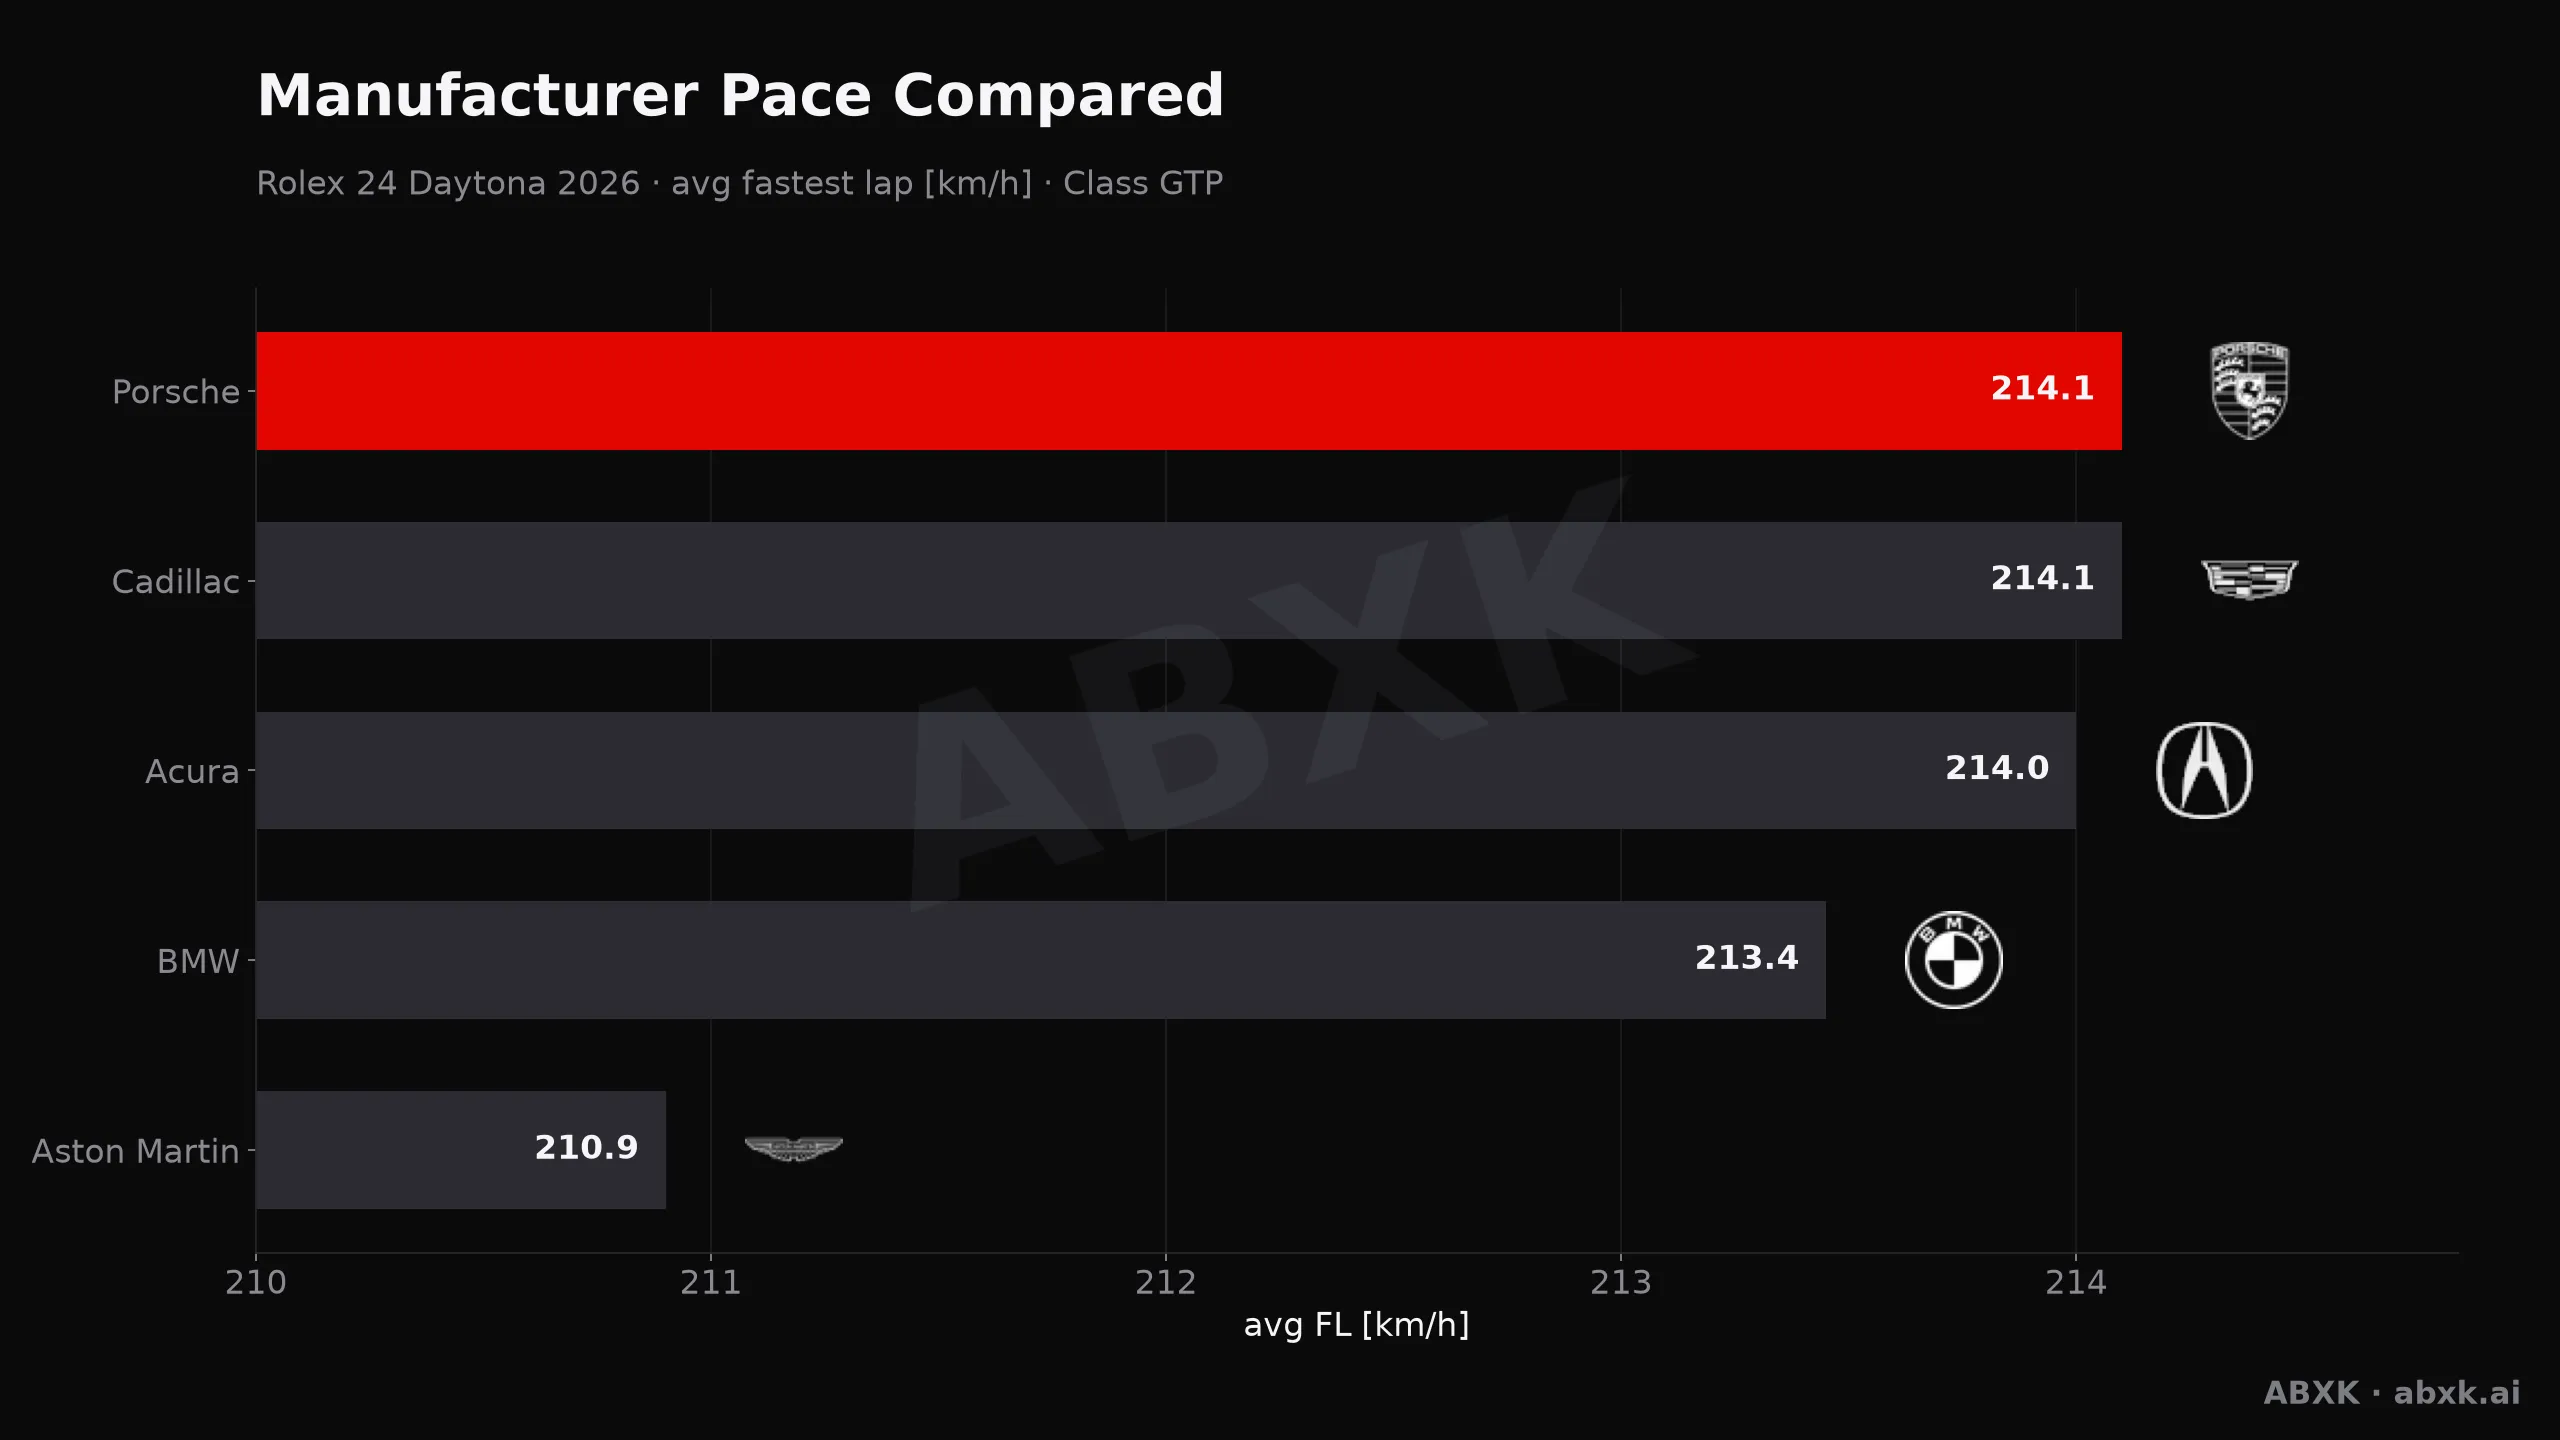
Average fastest lap speed per manufacturer in the GTP class. Higher is faster.
Figure 1 — Average fastest lap speed per manufacturer in the GTP class. Higher is faster.

Figure 1 sets the pace order side by side.

Who Went the Distance

The official result lists every starter as classified, so it does not mark retirements. We therefore measure how far each car actually got: a car counts as having gone the distance when it completed at least 95 % of its class winner’s laps.

By that measure 48 of 60 cars went the distance (80%). GTD Pro held up best at 87%, GTD worst at 76%. On average, a car covered 92% of the winning distance.
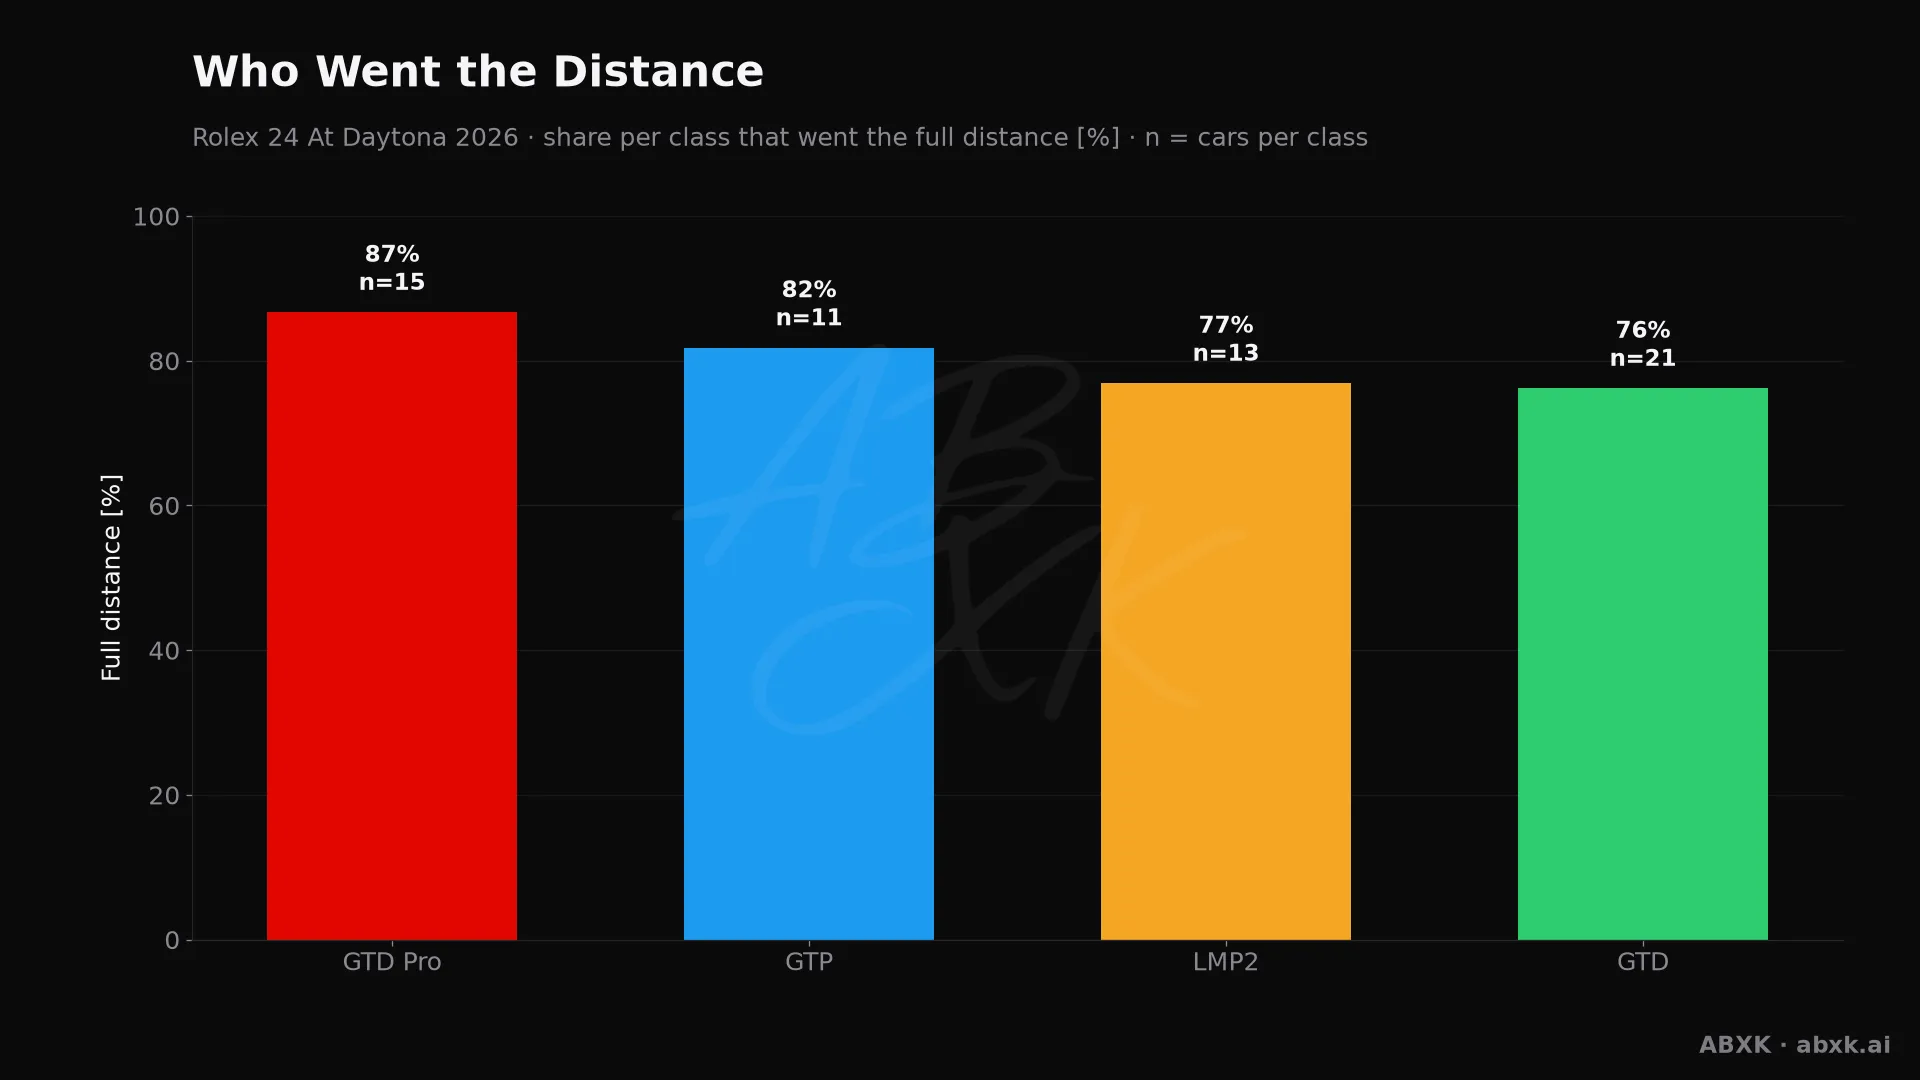
Share of cars per class that completed at least 95 % of the class winner's distance.
Figure 2 — Share of cars per class that completed at least 95 % of the class winner's distance.

Figure 2 compares the classes directly.

Efficiency Over the Distance

Our efficiency score multiplies average lap speed by laps completed and compares that to the class average. It rewards cars that were fast and stayed out of trouble. A value of 1.000 is exactly class average.

The top score goes to #6 Porsche with 1.023. The winner, #7, is not on top here. Track position and strategy turned into a result that raw efficiency alone does not explain.
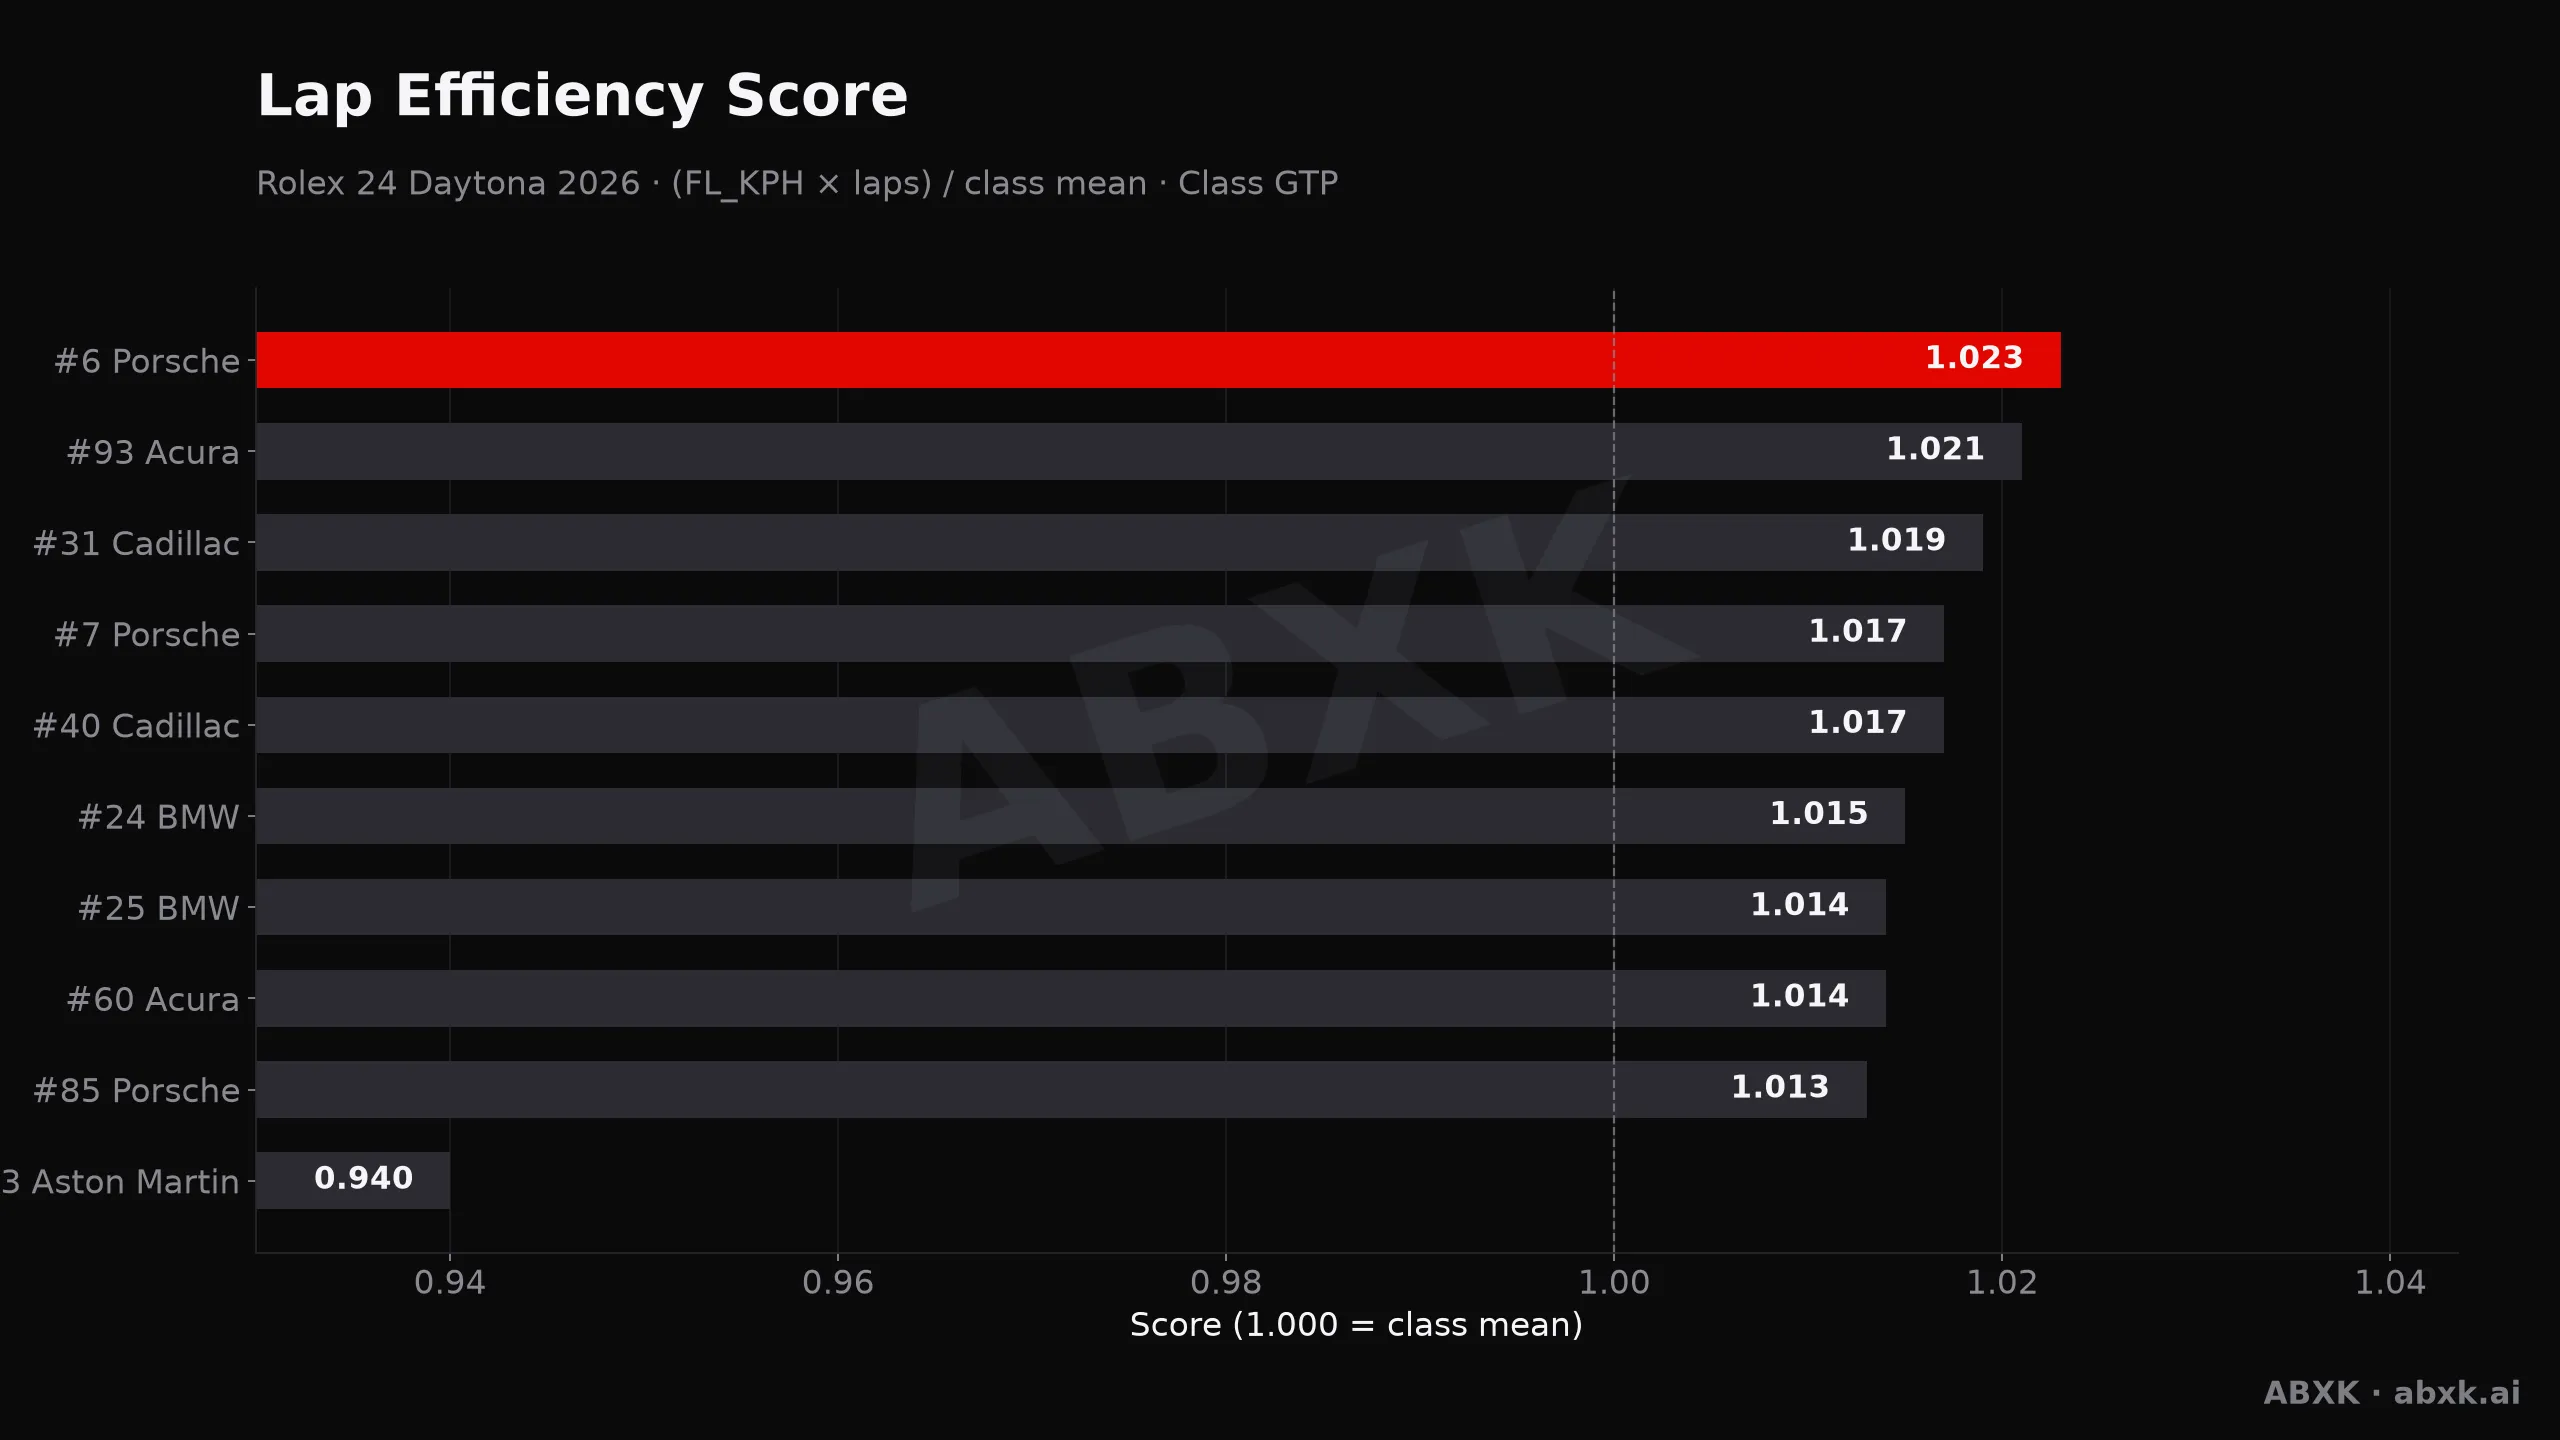
Efficiency score per car: average lap speed times laps, normalized to the class average.
Figure 3 — Efficiency score per car: average lap speed times laps, normalized to the class average.

Figure 3 ranks the cars by that score.

Night Versus Day

Top-class cars averaged 212.5 km/h in daylight and 212.2 km/h at night. The difference is 0.33 km/h — faster in daylight.

In other words: no measurable night effect. Darkness costs concentration and makes traffic harder to read, but it does not slow modern prototypes down.
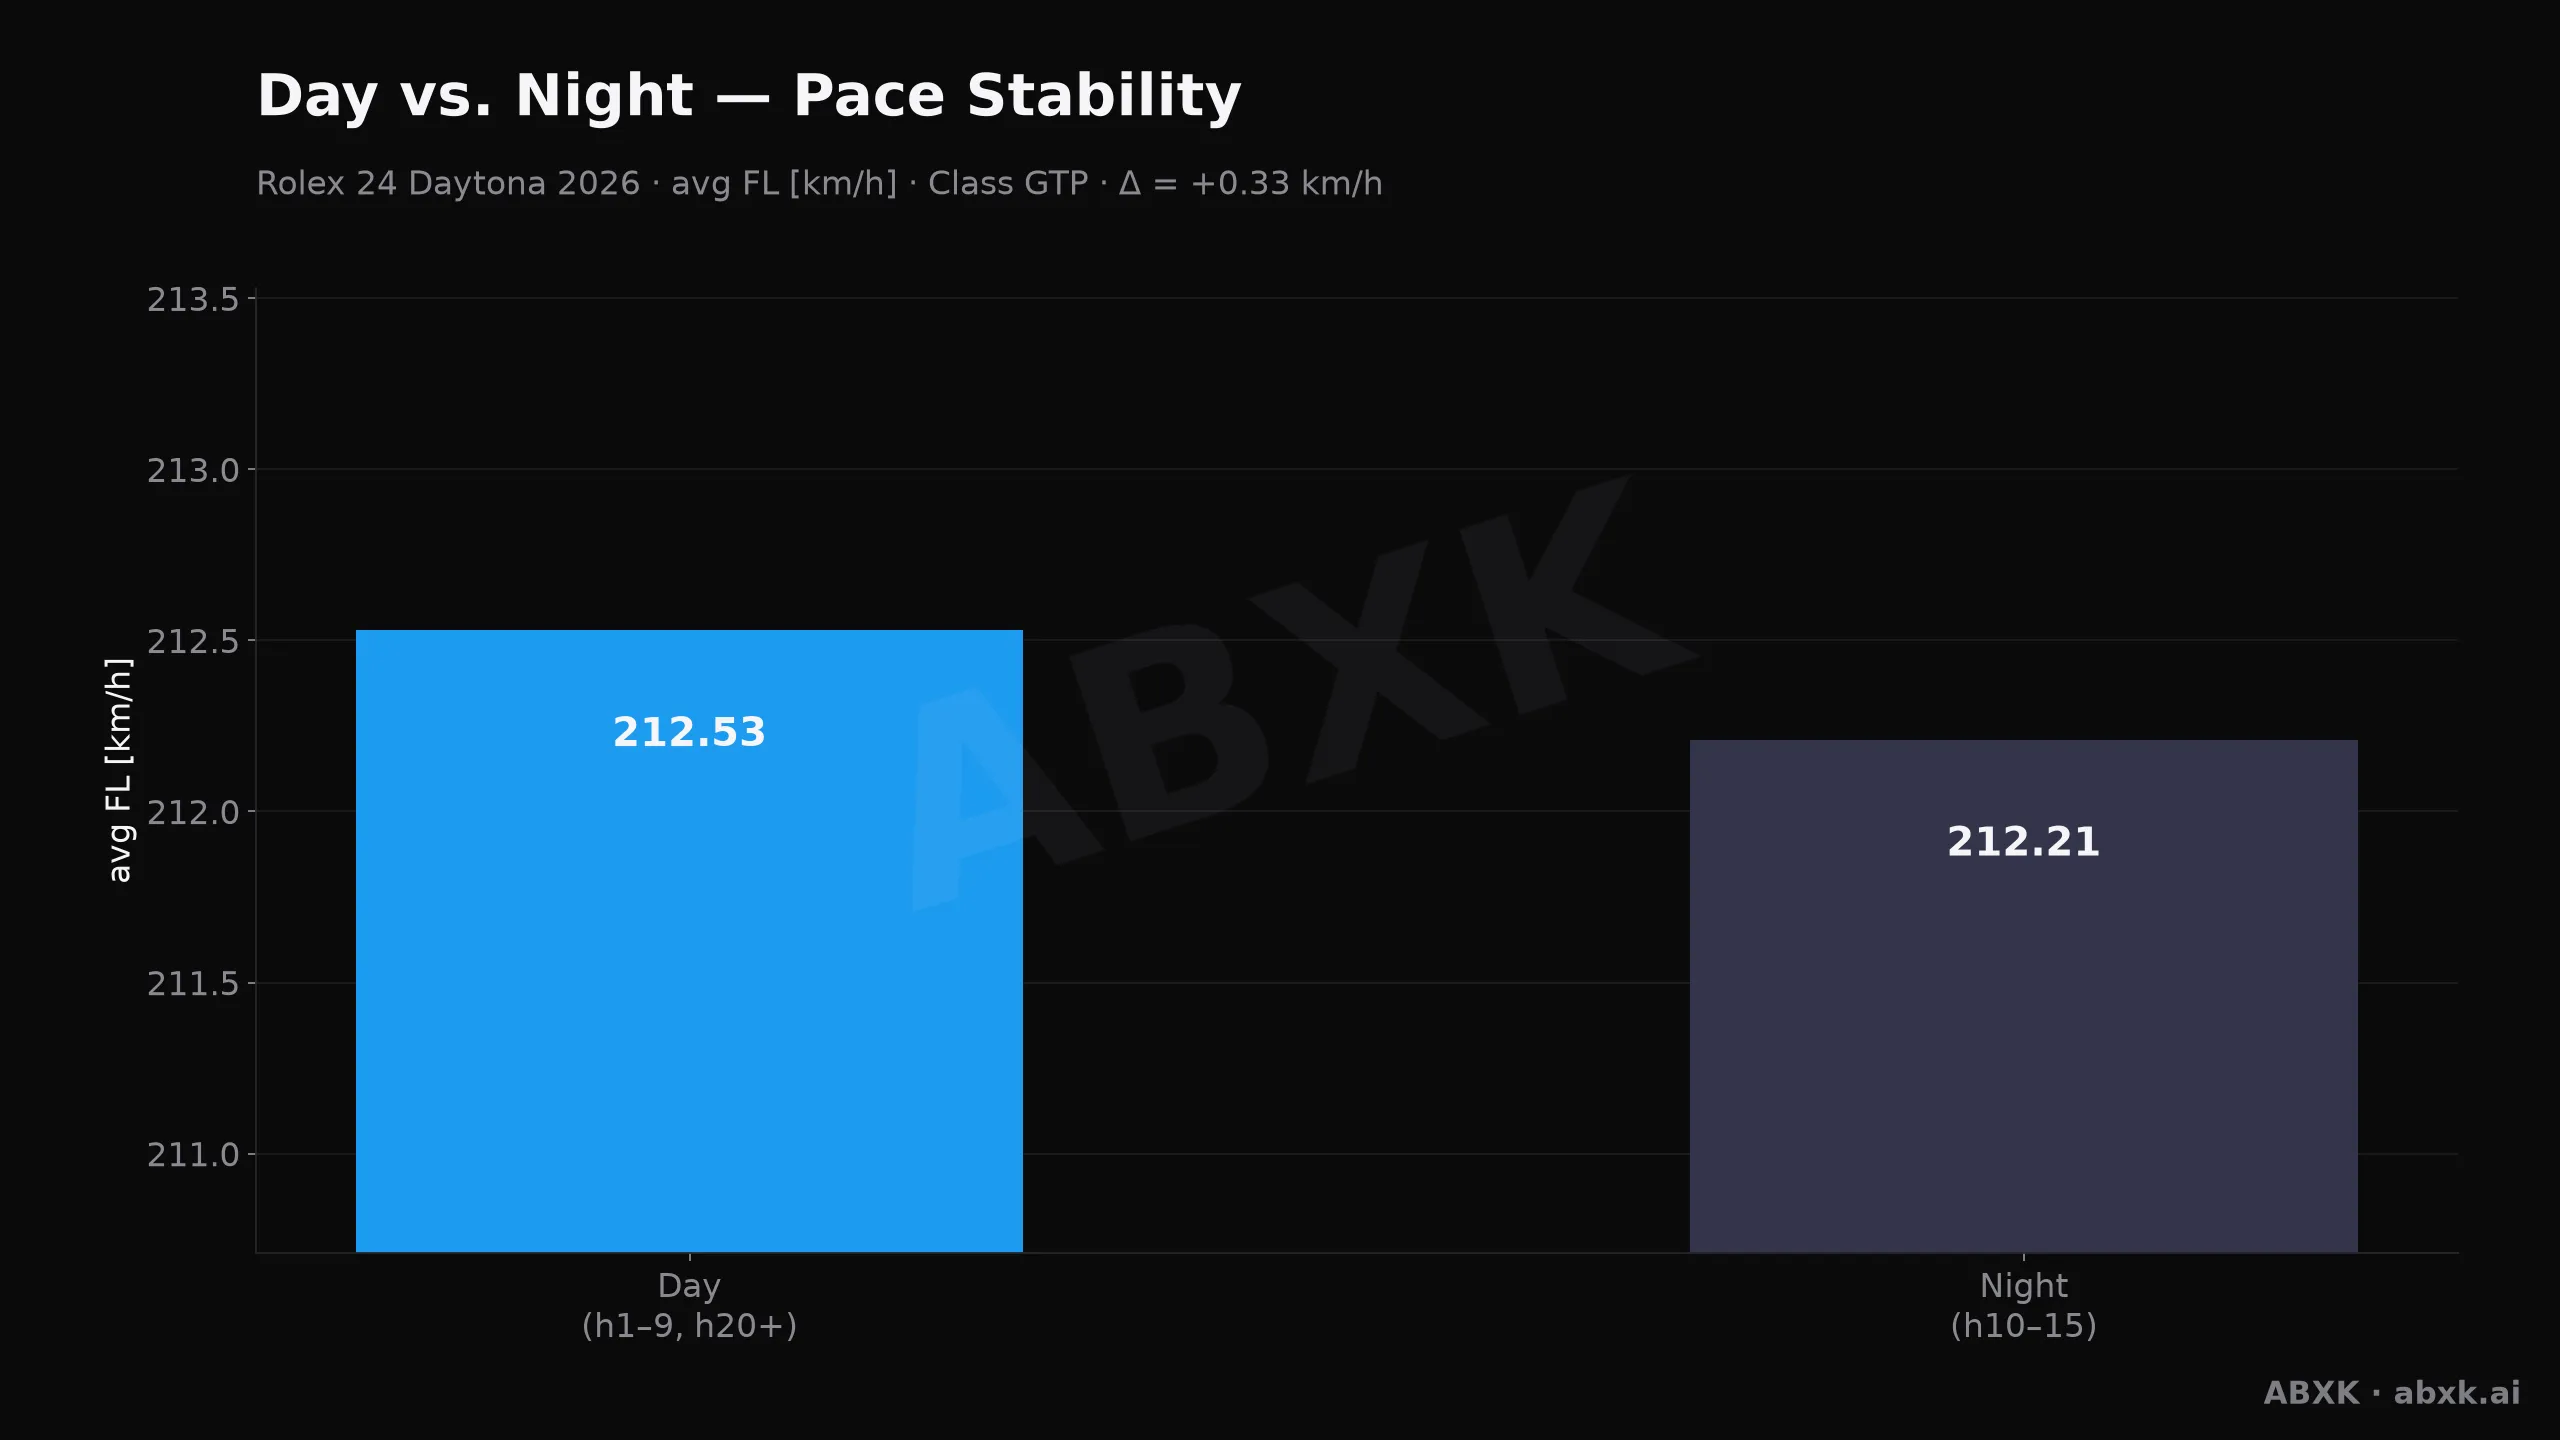
Average top-class pace in daylight hours versus night hours.
Figure 4 — Average top-class pace in daylight hours versus night hours.

Figure 4 puts both phases next to each other.

The Closing Phase

In the final hour, 50% of the field held position within ±1 place (n = 60). The closing hour stayed busy, with position changes across the field. The biggest single move came from #11, 31 places back.
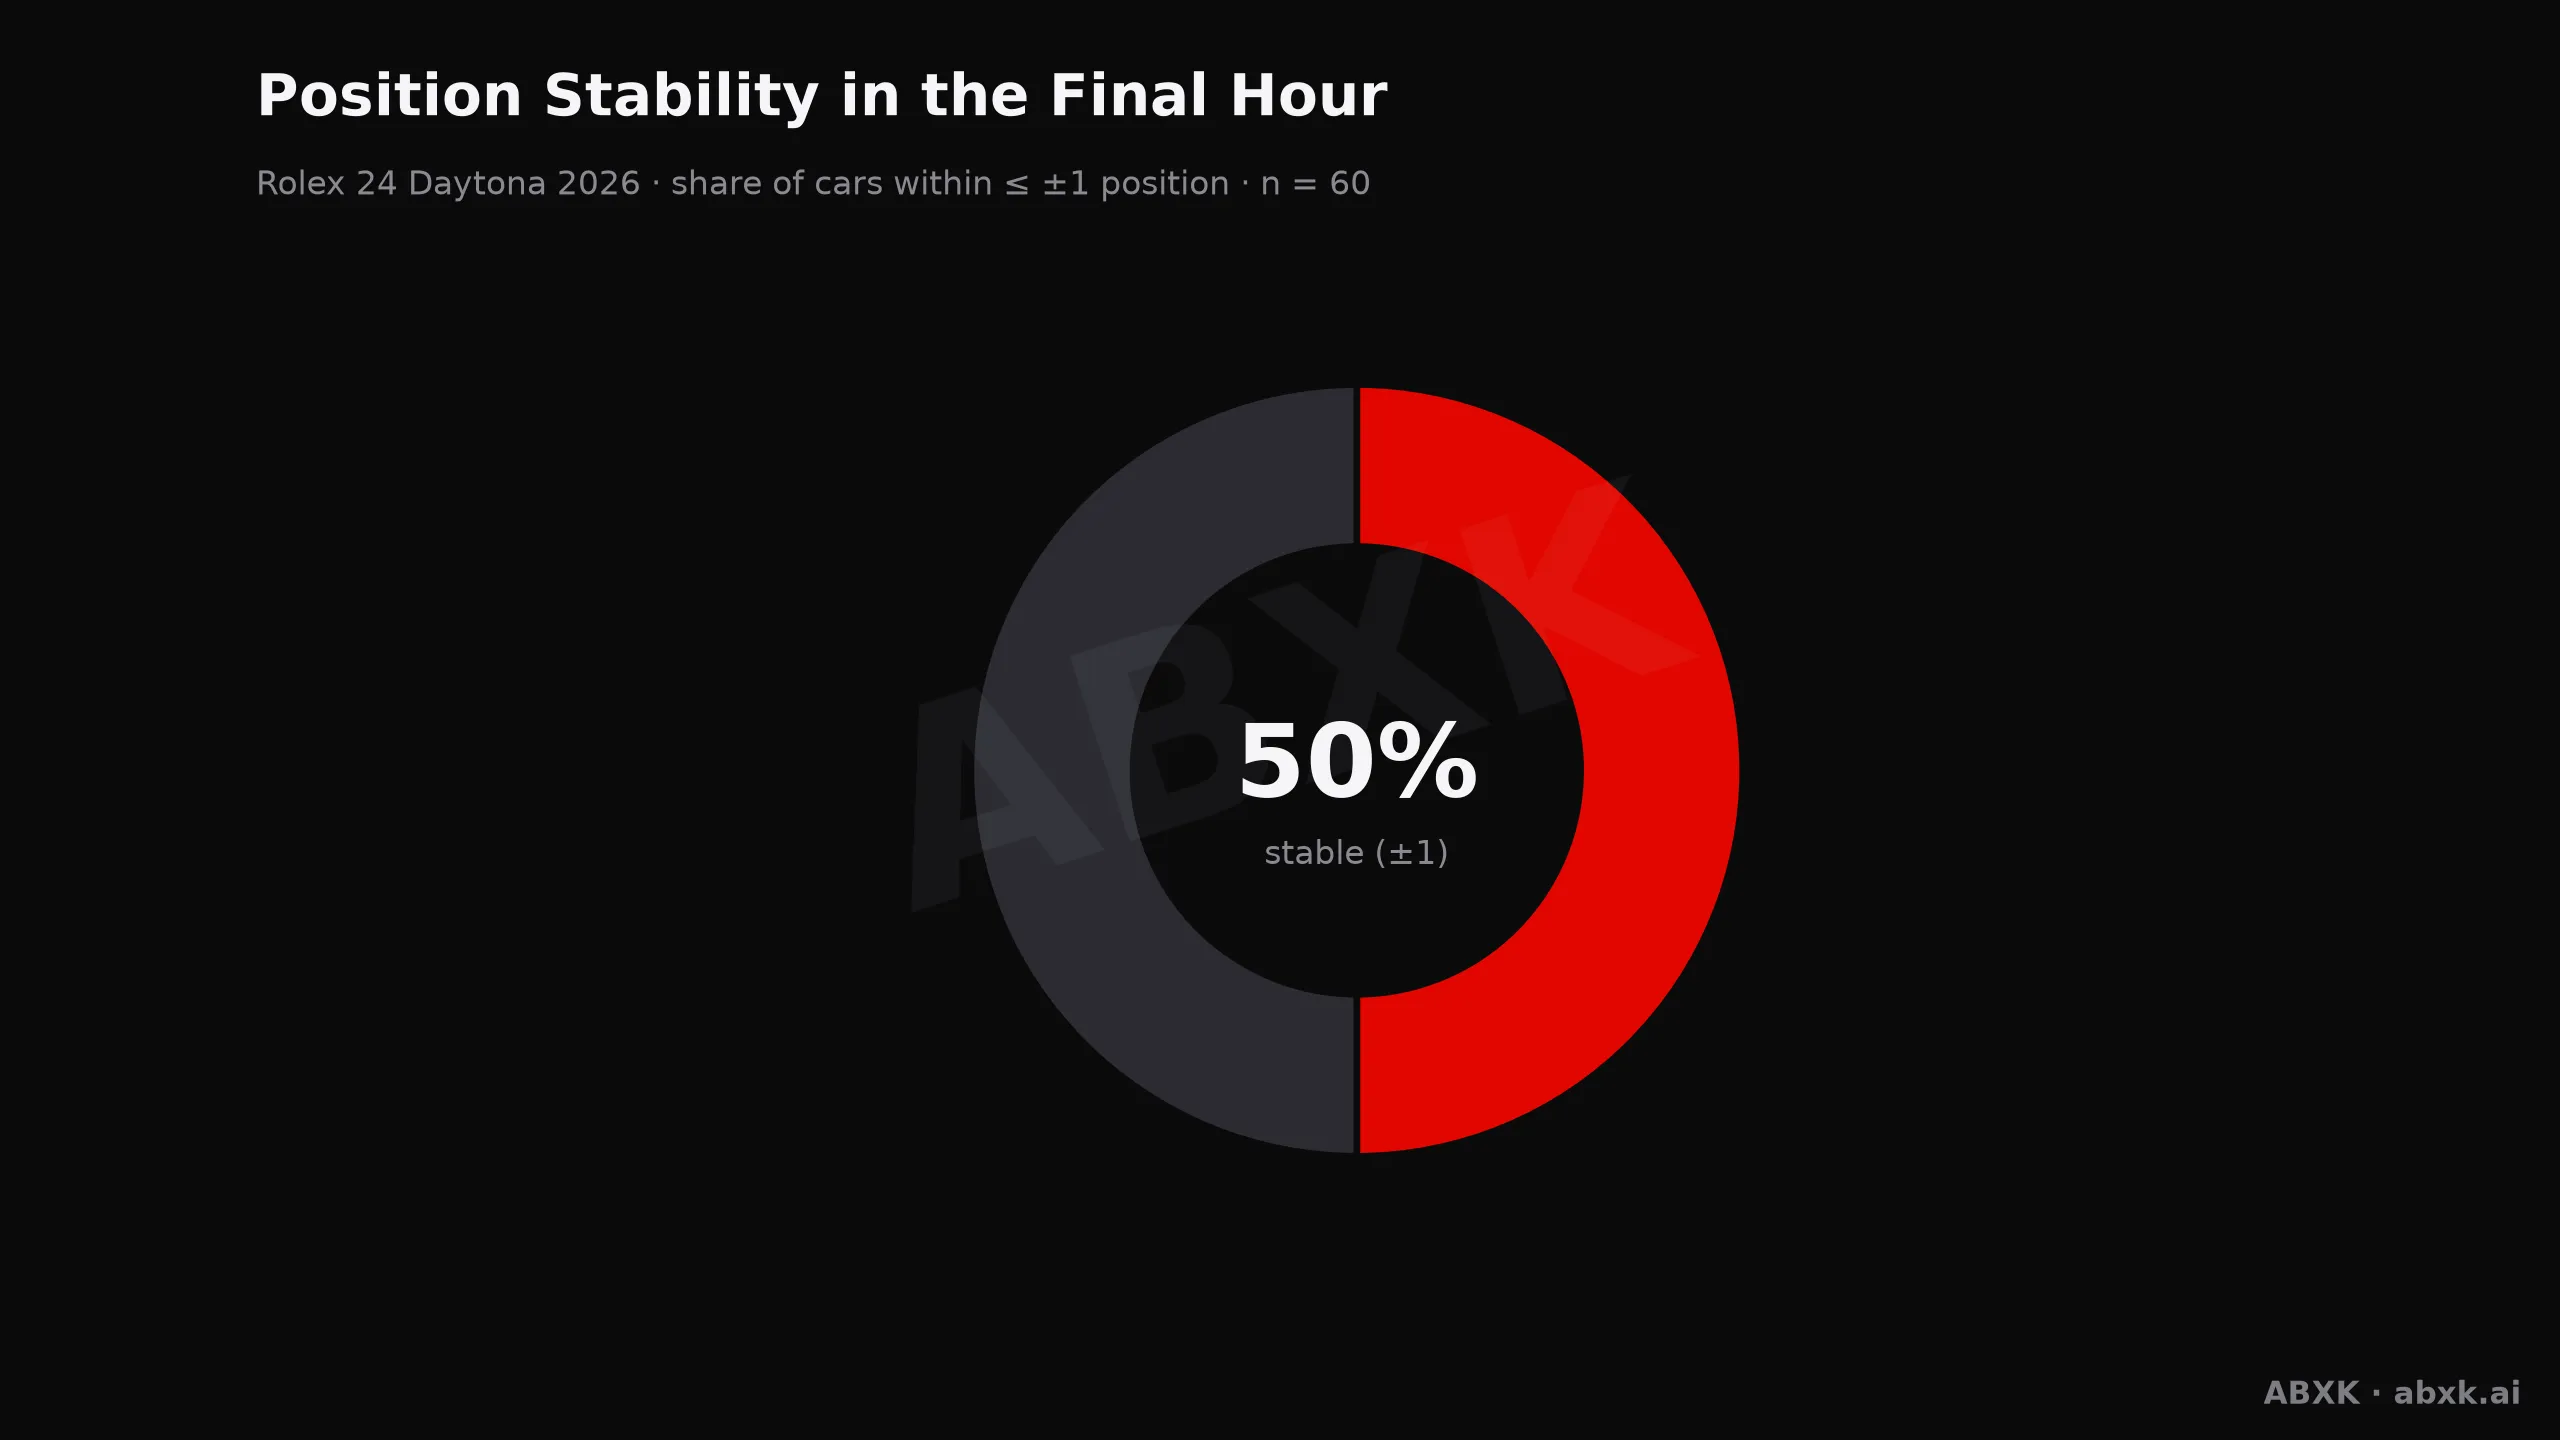
Share of cars that changed position by no more than one place in the final hour.
Figure 5 — Share of cars that changed position by no more than one place in the final hour.

Figure 5 shows how settled the finish really was.

Fastest Lap and Class Gaps

The fastest single lap of the race belongs to #6 Porsche (Porsche Penske Motorsport): 1:35.826 at 215.2 km/h. Crew: Laurens Vanthoor, Kevin Estre and Matt Campbell.

Between GTP and LMP2 sits a pace gap of 3.8 s per lap. That number decides how much traffic the leaders have to work through.

Class winners — GTP: #7 Porsche (Porsche Penske Motorsport), LMP2: #04 Oreca (Crowdstrike Racing by APR), GTD Pro: #1 BMW (Paul Miller Racing), GTD: #57 Mercedes-Benz (WINWARD RACING).

Putting the Race in Context

The winner averaged 168.1 km/h across 4,039 km. On a 5.729 km lap, that is the pace the whole strategy had to sustain.

We calculate the same metrics for every race in the archive: pace order, reliability by class, lead changes, winning margin, closing stability and efficiency. That makes this race directly comparable with every other round of the 2026 season — and with the seasons before it.

All figures are derived from the full classification of every race hour and are recalculated with each build.

Overall result GTP

Full final classification of the top class after 23 hours — car, driver crew, laps, gap, fastest race lap and average pace.

Overall result
PosNoManufacturer / CarTeam & DriversLapsGapFastest lapØ FL km/h
1#7PorschePorschePorsche 963Porsche Penske MotorsportFelipe Nasr · Julien Andlauer · Laurin Heinrich705+-1:36.414213.9
2#31CadillacCadillacCadillac V-Series.RCadillac WhelenJack Aitken · Earl Bamber · Frederik Vesti · Connor Zilisch705++1.5691:36.236214.3
3#24BMWBMWBMW M Hybrid V8BMW M Team WRTSheldon van der Linde · Dries Vanthoor · Robin Frijns · Rene Rast705++21.3861:36.584213.5
4#6PorschePorschePorsche 963Porsche Penske MotorsportLaurens Vanthoor · Kevin Estre · Matt Campbell705++31.8221:35.826215.2
5#93AcuraAcuraAcura ARX-06Acura Meyer Shank Racing w/Curb AgajanianRenger van der Zande · Nick Yelloly · Alex Palou · Kaku Ohta705++45.6771:36.058214.7
6#40CadillacCadillacCadillac V-Series.RCadillac Wayne Taylor RacingJordan Taylor · Louis Deletraz · Colton Herta705++54.0171:36.401214
7#85PorschePorschePorsche 963JDC-Miller MotorSportsTijmen van der Helm · Nico Pino · Kaylen Frederick705++1:10.7361:36.761213.2
8#25BMWBMWBMW M Hybrid V8BMW M Team WRTRaffaele Marciello · Philipp Eng · Marco Wittmann · Kevin Magnussen705++1:13.4431:36.664213.4
9#60AcuraAcuraAcura ARX-06Acura Meyer Shank Racing w/Curb AgajanianTom Blomqvist · Colin Braun · Scott Dixon · Aj Allmendinger705++1:22.5631:36.677213.3
31#23Aston MartinAston MartinAston Martin ValkyrieASTON MARTIN THOR TeamRoss Gunn · Roman de Angelis · Alex Riberas · Marco Sorensen661+44 Laps1:37.785210.9
50#10CadillacCadillacCadillac V-Series.RCadillac Wayne Taylor RacingRicky Taylor · Filipe Albuquerque · Will Stevens629+76 Laps1:36.400214

Season context: the full 2026 WEC season in data · all-time WEC records

Class winners in detail

The winners of each class with overall position, car, crew and fastest lap.

Class winners in detail
ClassOverallNoManufacturer / CarTeam & DriversLapsFastest lap
GTPP1#7PorschePorschePorsche 963Porsche Penske MotorsportFelipe Nasr · Julien Andlauer · Laurin Heinrich7051:36.414
LMP2P10#04OrecaOreca 07Crowdstrike Racing by APRGeorge Kurtz · Alex Quinn · Toby Sowery · Malthe Jakobsen6861:39.387
GTD ProP19#1BMWBMWBMW M4 GT3 EvoPaul Miller RacingNeil Verhagen · Connor de Phillippi · Max Hesse · Dan Harper6621:46.459
GTDP27#57Mercedes-BenzMercedes-BenzMercedes-AMG GT3WINWARD RACINGRussell Ward · Philip Ellis · Indy Dontje · Lucas Auer6611:47.081

Manufacturer pace

Average of the fastest lap speed per manufacturer. It measures real pace over the distance, not a single outlier.

Porsche
214.1
Cadillac
214.1
Acura
214
BMW
213.45

Who went the distance

This classification lists every starter as classified, so it shows no retirements. We measure the share of cars per class that completed at least 95 % of their class winner's distance.

GTD
76.2% · n21
GTD Pro
86.7% · n15
GTP
81.8% · n11
LMP2
76.9% · n13

Lap efficiency score

(avg FL km/h × laps) normalized to the class mean. It combines pace, distance and durability in one number — 1.000 = class mean.

#6 Porsche
1.023
#93 Acura
1.021
#31 Cadillac
1.019
#7 Porsche
1.017
#40 Cadillac
1.017
#24 BMW
1.015
#25 BMW
1.014
#60 Acura
1.014

Day vs. Night

Average top-class pace by day versus night (hours 10–15).

212.53Day
212.21Night
Δ +0.33 km/h. No relevant night degradation — modern hybrid prototypes hold their pace level in the dark.

Position stability, final hour

Share of cars that held their position within ±1 in the final hour (n=60).

50%

A lively closing phase with numerous late position changes.

Race dynamics compared

The same metrics for every race — so Le Mans is directly comparable with Daytona, and year with year.

15Lead changes (6 leaders)
+1.569Winning margin over P2
3.8 sPace delta GTP → LMP2
GTPtop class analyzed
4,039 kmWinning distance
168.1Average speed km/h
0Position changes total
228Drivers in the field

Fastest race lap

The quickest single lap of the whole race — peak pace, not race pace.

1:35.826 · 215.2 km/h — #6 Porsche, Porsche Penske Motorsport (GTP)
Laurens Vanthoor · Kevin Estre · Matt Campbell