Motorsport Data & AI · 6 Hours of the Americas 2020 · Season 2019-2020

6 Hours of the Americas 2020 — AI Data Analysis

Rebellion wins the 6 Hours of the Americas 2020 with the #1 Rebellion R13. Pace order, reliability by class, lead changes and the closing phase in a data check.

#1Winner · Rebellion
189Laps led
30Cars total
6 hanalyzed

Winning crew · #1 Rebellion RacingBruno Senna · Gustavo Menezes · Norman Nato

Rebellion won the 6 Hours of the Americas 2020 at Circuit of the Americas. The #1 Rebellion R13 of Rebellion Racing covered 189 laps over 6 hours, a race distance of 1,042 km. The winning crew: Bruno Senna, Gustavo Menezes and Norman Nato. The margin to second place was 51.5 s. The fastest manufacturer also produced the winner.

How the Lead Was Won

Across the race we counted 2 lead changes among 2 different cars in the LMP1 class. At the closest point, first and second were only 23.7 s apart. For 2 of 6 measured hours the gap stayed under 30 seconds.

The leader was never fully out of reach, but the pressure came in waves rather than all race long.
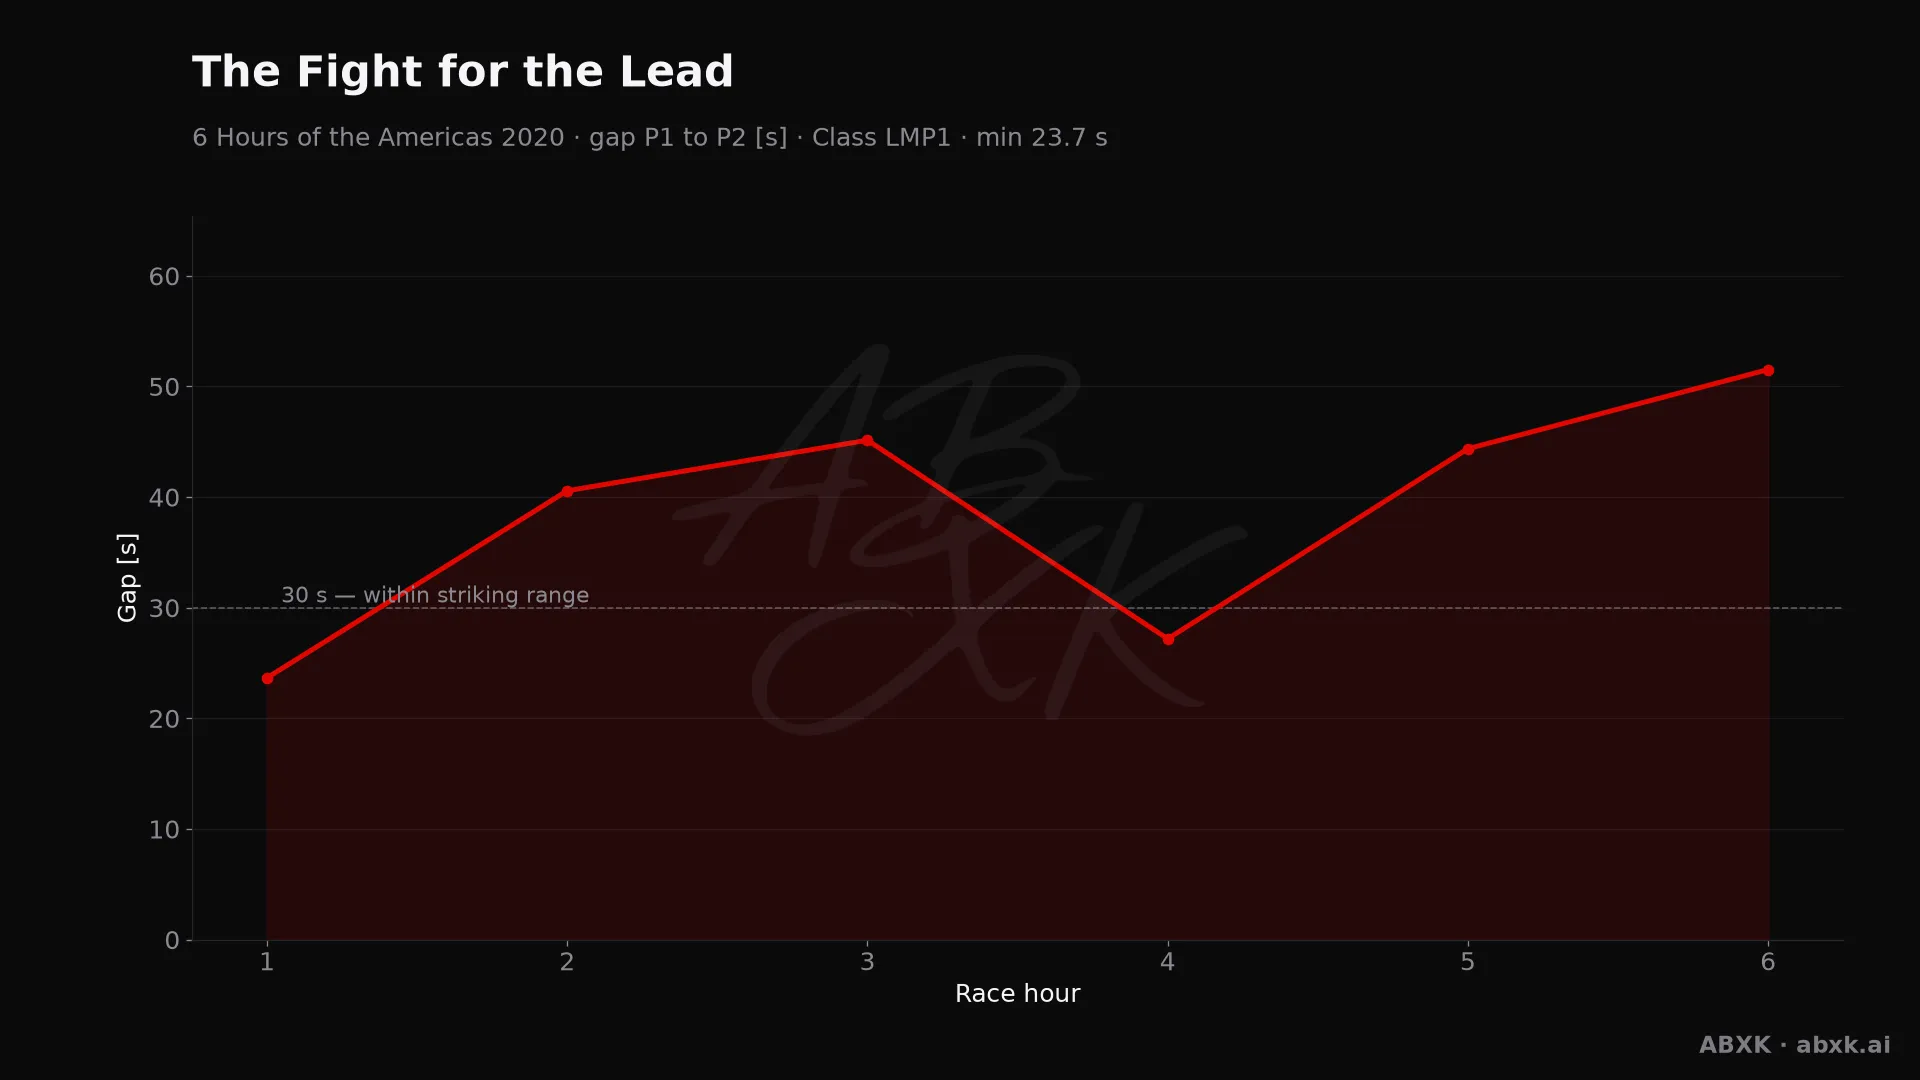
Gap between first and second in the LMP1 class, hour by hour. Peaks mark pit stops, safety cars and incidents.
Figure 1 — Gap between first and second in the LMP1 class, hour by hour. Peaks mark pit stops, safety cars and incidents.

Figure 1 shows how that gap moved over the distance.

Manufacturer Pace

We rank pace by the average of each manufacturer’s fastest lap. That measures real speed over the distance instead of one lucky lap. The order at the top: Rebellion (181.2 km/h), Toyota (178.4 km/h).

Between the fastest and the slowest manufacturer in the LMP1 class lie 2.8 km/h. That is a wide spread. At this track, the concept differences show clearly.
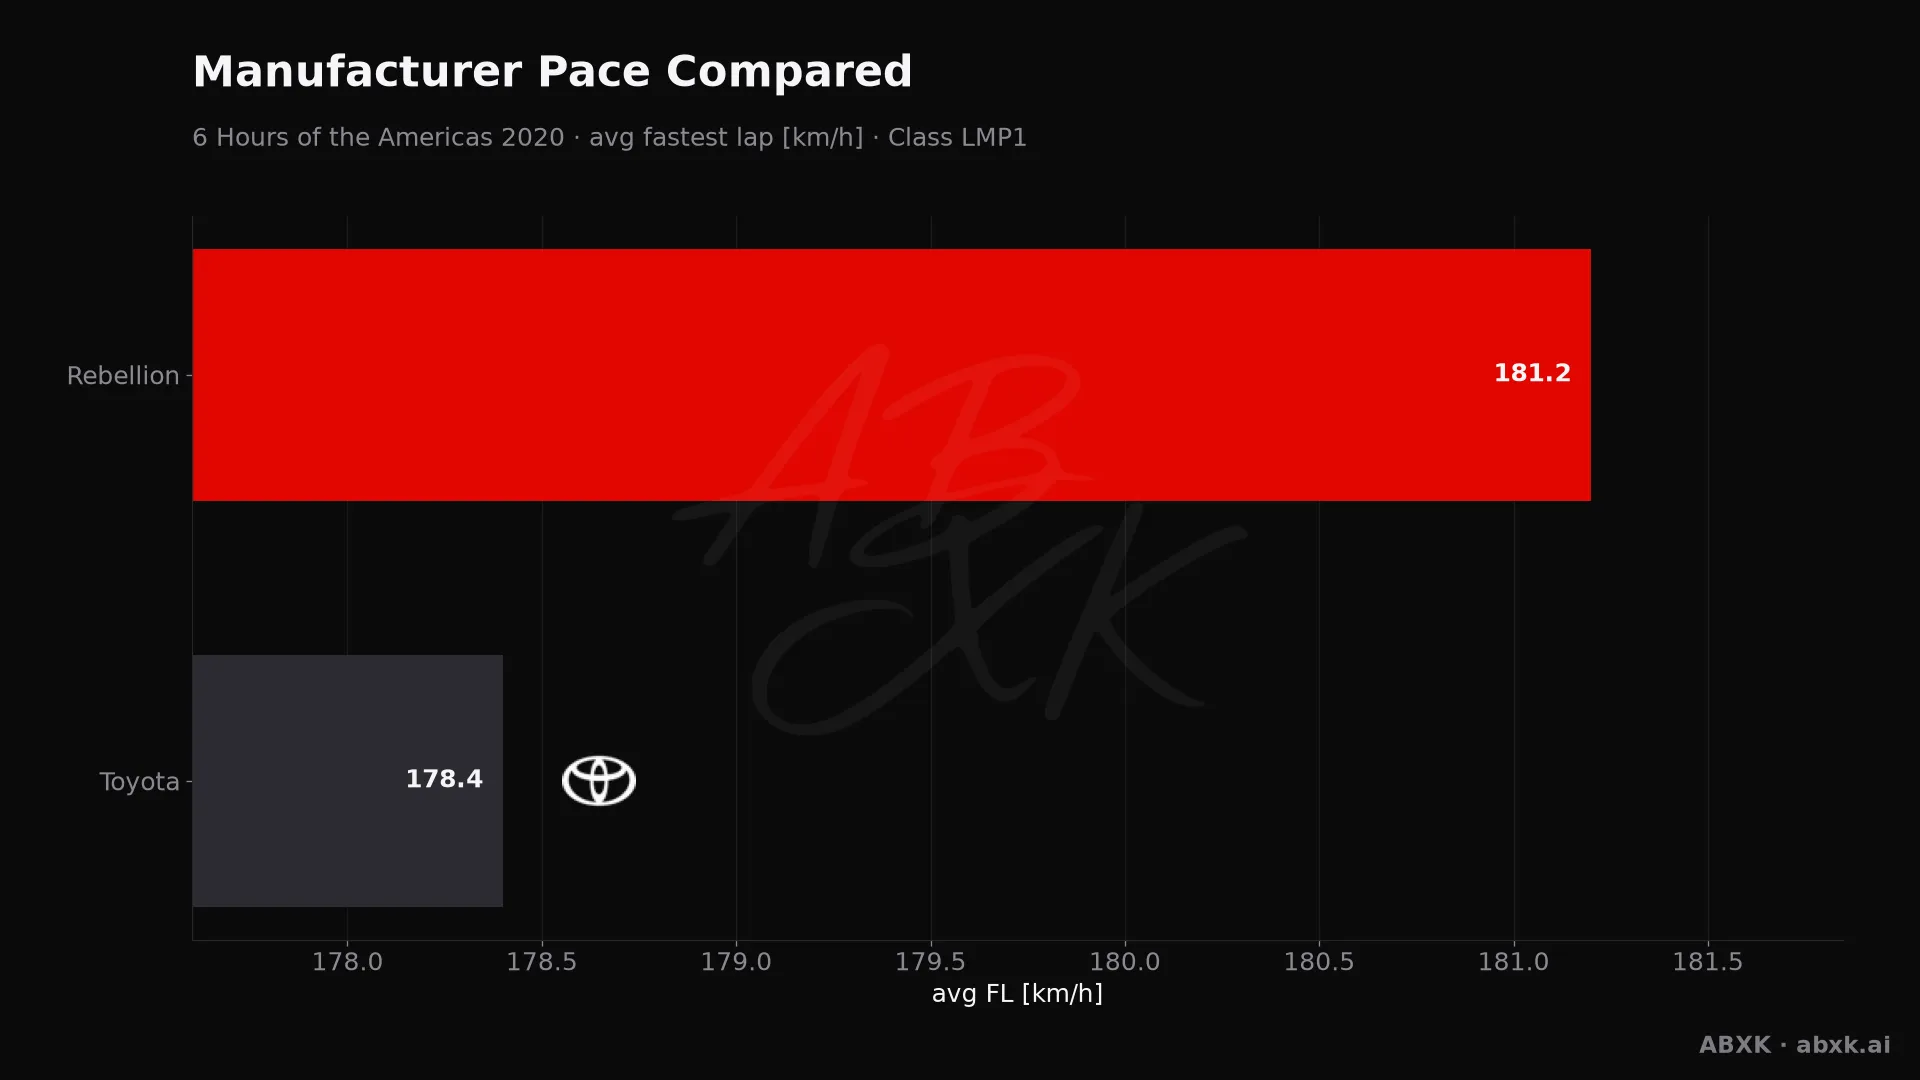
Average fastest lap speed per manufacturer in the LMP1 class. Higher is faster.
Figure 2 — Average fastest lap speed per manufacturer in the LMP1 class. Higher is faster.

Figure 2 sets the pace order side by side.

Reliability by Class

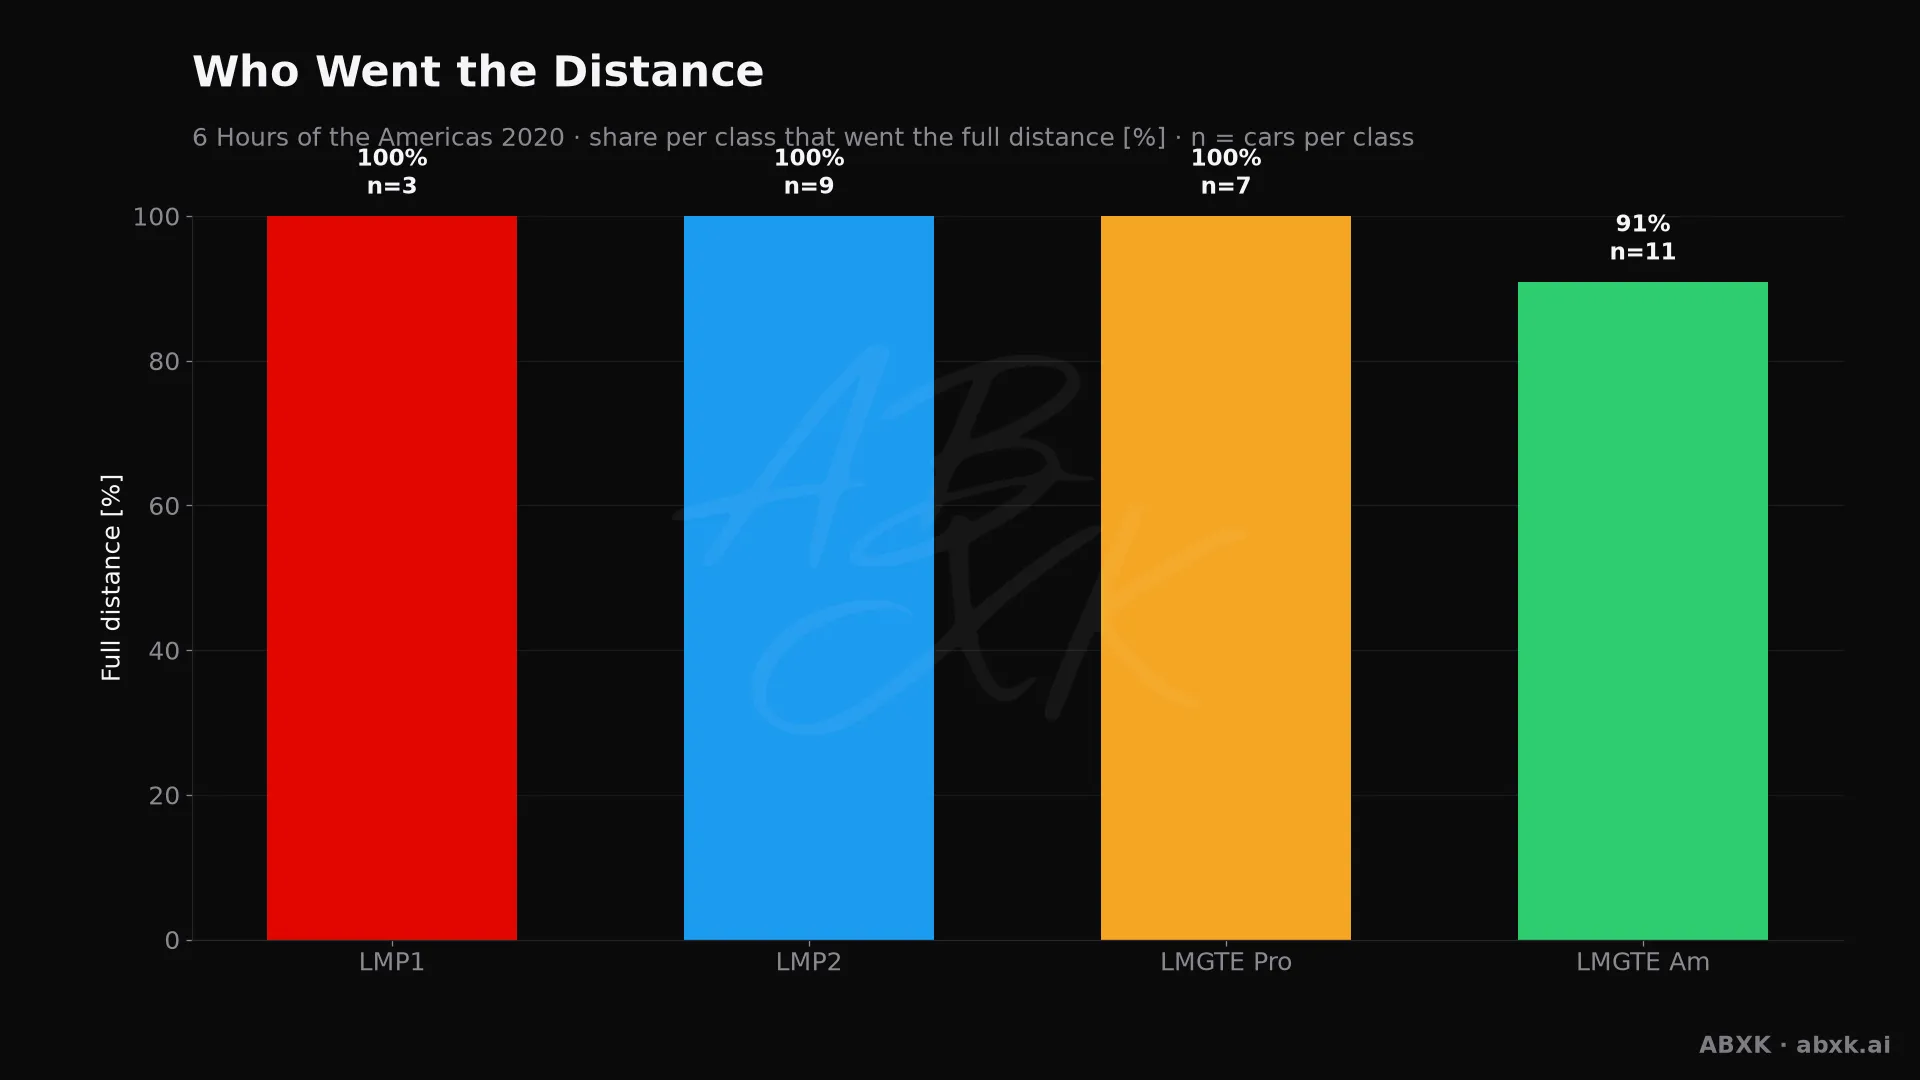
All 30 cars were classified at the flag. A race without a single retirement is rare and says a lot about how it was run.

Reliability decided nothing here, so the result came down to pace and strategy alone.

Figure 3 compares the classes directly.

Efficiency Over the Distance

Our efficiency score multiplies average lap speed by laps completed and compares that to the class average. It rewards cars that were fast and stayed out of trouble. A value of 1.000 is exactly class average.

The top score goes to #1 Rebellion with 1.014. That is the winning car — speed and durability came from the same package.
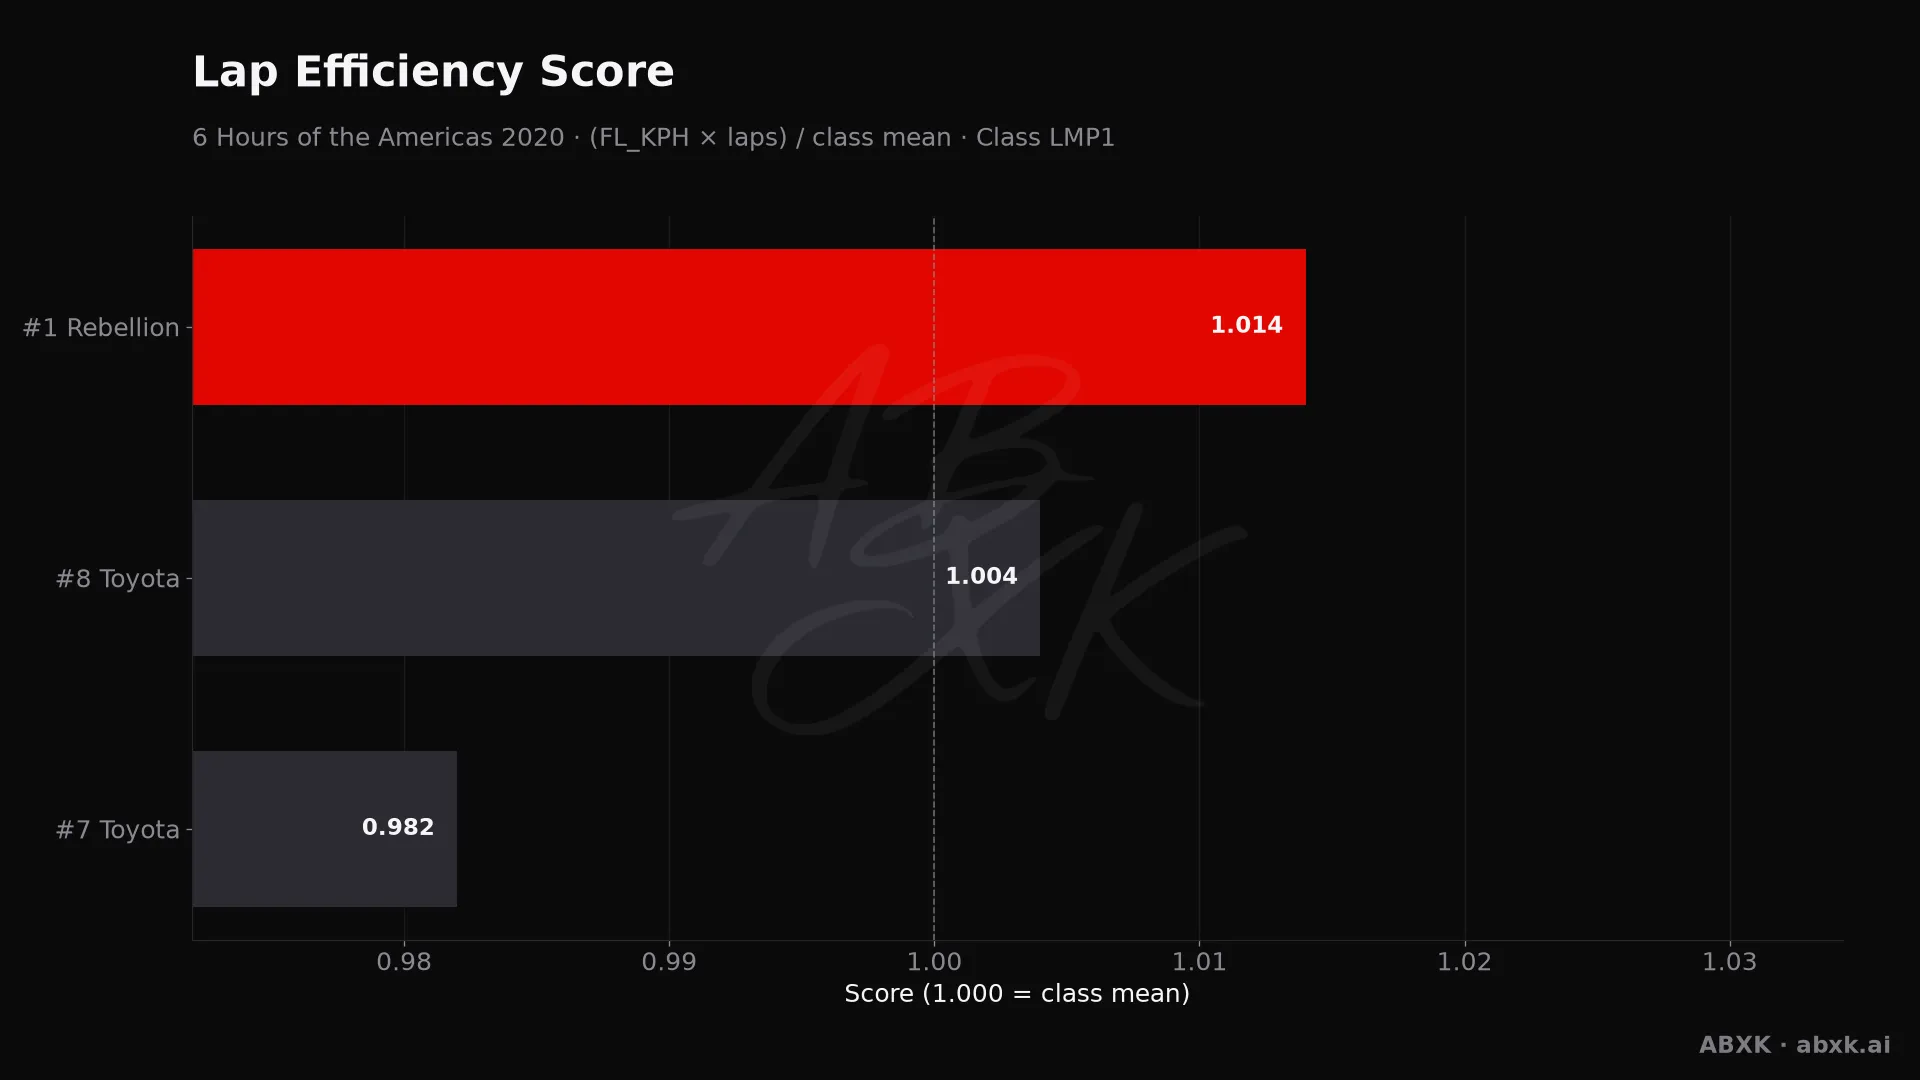
Efficiency score per car: average lap speed times laps, normalized to the class average.
Figure 4 — Efficiency score per car: average lap speed times laps, normalized to the class average.

Figure 4 ranks the cars by that score.

The Closing Phase

In the final hour, 83% of the field held position within ±1 place (n = 30). Most of the order was set, but a few fights ran to the end. The biggest single move came from #29 Oreca, 3 places back.
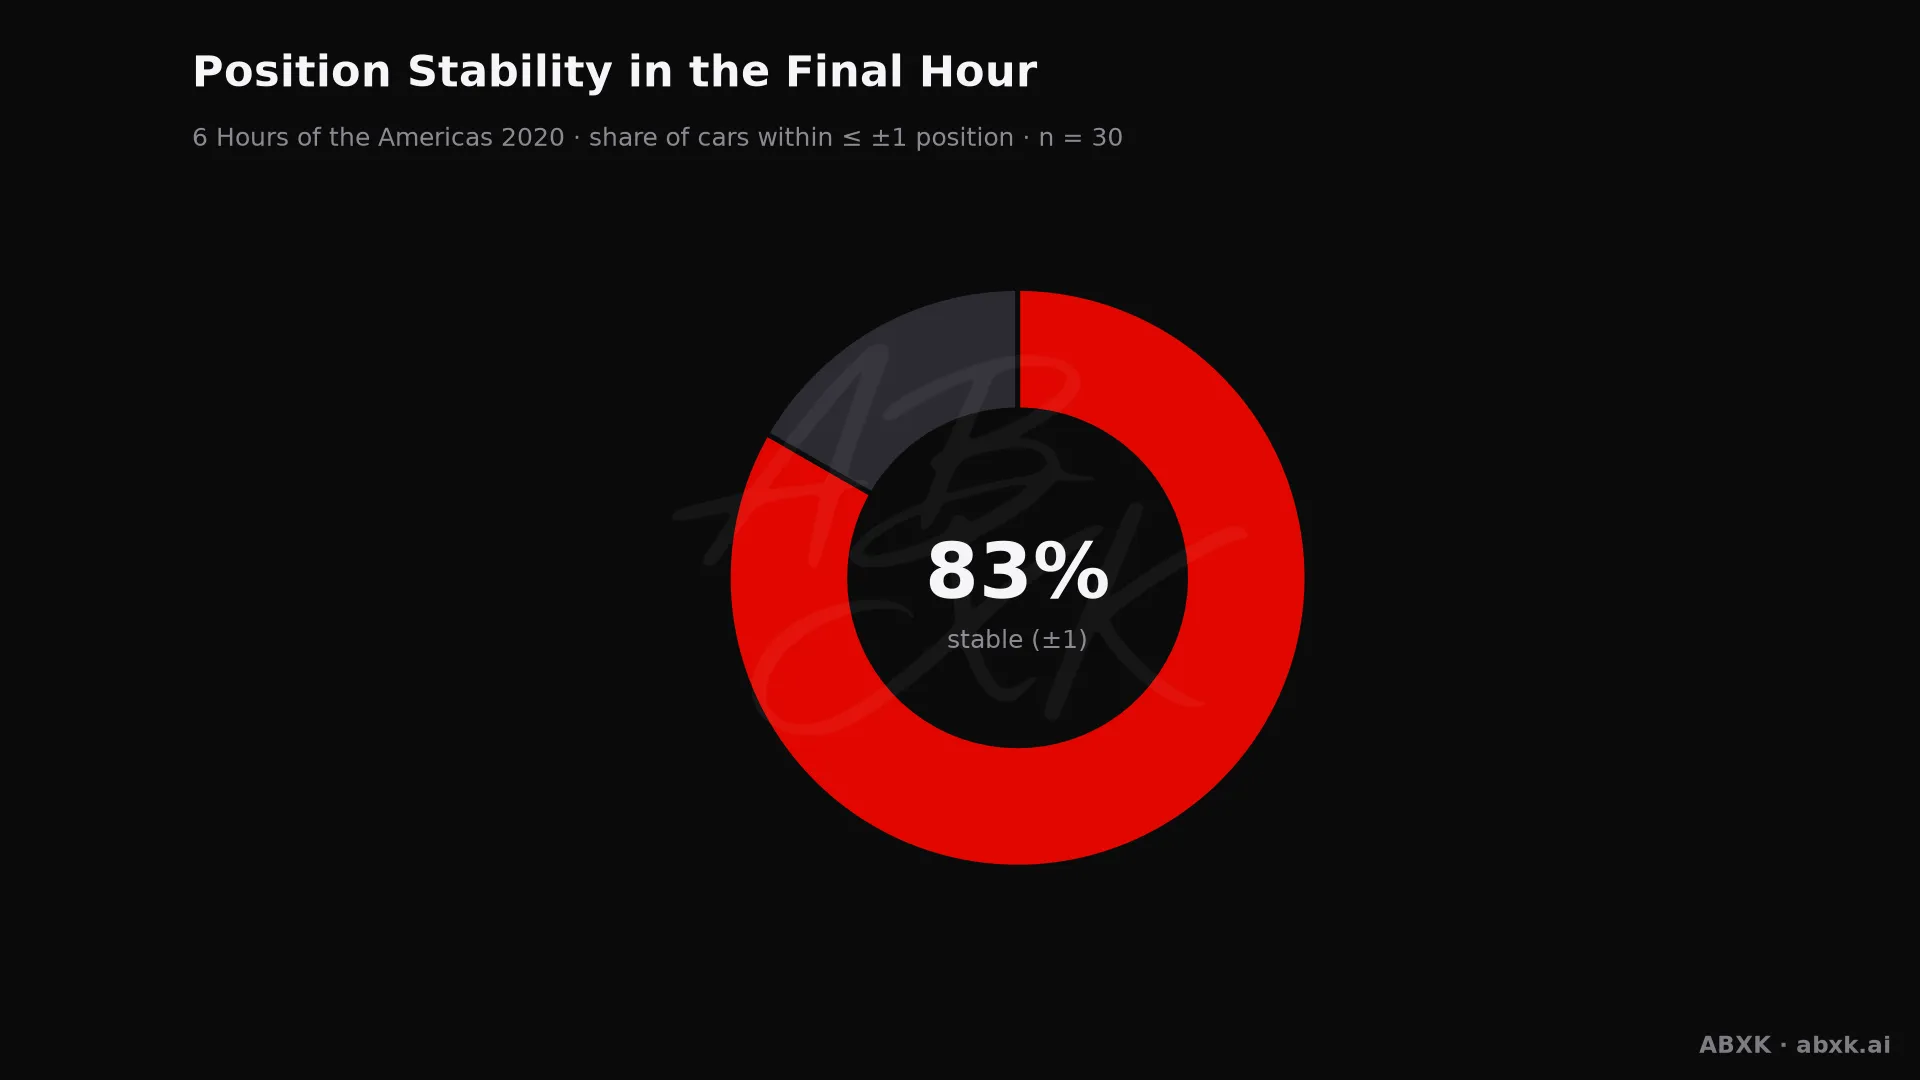
Share of cars that changed position by no more than one place in the final hour.
Figure 5 — Share of cars that changed position by no more than one place in the final hour.

Figure 5 shows how settled the finish really was.

Fastest Lap and Class Gaps

The fastest single lap of the race belongs to #1 Rebellion (Rebellion Racing): 1:49.503 at 181.2 km/h. Crew: Bruno Senna, Gustavo Menezes and Norman Nato.

Between LMP1 and LMP2 sits a pace gap of 3.5 s per lap. That number decides how much traffic the leaders have to work through.

Class winners — LMP1: #1 Rebellion (Rebellion Racing), LMP2: #22 Oreca (United Autosports), LMGTE Pro: #95 Aston Martin (Aston Martin Racing), LMGTE Am: #90 Aston Martin (TF Sport).

Putting the Race in Context

The winner averaged 172.9 km/h across 1,042 km. On a 5.513 km lap, that is the pace the whole strategy had to sustain.

We calculate the same metrics for every race in the archive: pace order, reliability by class, lead changes, winning margin, closing stability and efficiency. That makes this race directly comparable with every other round of the 2019-2020 season — and with the seasons before it.

All figures are derived from the full classification of every race hour and are recalculated with each build.

Overall result LMP1

Full final classification of the top class after 6 hours — car, driver crew, laps, gap, fastest race lap and average pace.

Overall result
PosNoManufacturer / CarTeam & DriversLapsGapFastest lapØ FL km/h
1#1RebellionRebellion R13Rebellion RacingBruno Senna · Gustavo Menezes · Norman Nato1891:49.503181.2
2#8ToyotaToyotaToyota TS050 HybridToyota Gazoo RacingSébastien Buemi · Kazuki Nakajima · Brendon Hartley189+51.5241:50.589179.5
3#7ToyotaToyotaToyota TS050 HybridToyota Gazoo RacingMike Conway · Kamui Kobayashi · Jose Maria Lopez187+2 Laps1:51.970177.3

Season context: the full 2019-2020 WEC season in data · all-time WEC records

Class winners in detail

The winners of each class with overall position, car, crew and fastest lap.

Class winners in detail
ClassOverallNoManufacturer / CarTeam & DriversLapsFastest lap
LMP1P1#1RebellionRebellion R13Rebellion RacingBruno Senna · Gustavo Menezes · Norman Nato1891:49.503
LMP2P4#22OrecaOreca 07United AutosportsPhilip Hanson · Filipe Albuquerque · Paul di Resta1821:54.257
LMGTE ProP13#95Aston MartinAston MartinAston Martin Vantage AMRAston Martin RacingMarco Sørensen · Nicki Thiim1732:02.522
LMGTE AmP19#90Aston MartinAston MartinAston Martin Vantage AMRTF SportSalih Yoluc · Charles Eastwood · Jonathan Adam1702:03.967

Manufacturer pace

Average of the fastest lap speed per manufacturer. It measures real pace over the distance, not a single outlier.

Rebellion
181.2
Toyota
178.4

Who went the distance

This classification lists every starter as classified, so it shows no retirements. We measure the share of cars per class that completed at least 95 % of their class winner's distance.

LMGTE Am
90.9% · n11
LMGTE Pro
100% · n7
LMP1
100% · n3
LMP2
100% · n9

Lap efficiency score

(avg FL km/h × laps) normalized to the class mean. It combines pace, distance and durability in one number — 1.000 = class mean.

#1 Rebellion
1.014
#8 Toyota
1.004
#7 Toyota
0.982

Position stability, final hour

Share of cars that held their position within ±1 in the final hour (n=30).

83%

Mostly stable, but some late position battles.

Race dynamics compared

The same metrics for every race — so Le Mans is directly comparable with Daytona, and year with year.

2Lead changes (2 leaders)
51.524Winning margin over P2
3.5 sPace delta LMP1 → LMP2
LMP1top class analyzed
23.7 sClosest lead gap
2/6Hours inside 30 s
1,042 kmWinning distance
172.9Average speed km/h
198Position changes total
83Drivers in the field

Fastest race lap

The quickest single lap of the whole race — peak pace, not race pace.

1:49.503 · 181.2 km/h — #1 Rebellion, Rebellion Racing (LMP1)
Bruno Senna · Gustavo Menezes · Norman Nato

Steadiest cars

Laps per hour and their spread. A low spread means few stops, few incidents, a clean rhythm.

NoManufacturerLaps/hSpread
#1Rebellion31.4±0.49
#8Toyota31.4±0.49
#7Toyota31±0.89

WEC record at this circuit

The World Endurance Championship has raced here 8 times in the seasons we analyze, and Porsche has won most often (4). Every entry links to the full data analysis of that race.

Fastest lap on record
1:47.052 · 185.5 km/h
#8 Audi, Audi Sport Team Joest (2016)
Highest race average
176 km/h
Porsche (2017)
Seasons
2013, 2014, 2015, 2016, 2017, 2019-2020, 2024, 2025
WEC races at this circuit
YearRaceWinnerDistanceCars
20256 Hours of the Americas#6 Porsche
Porsche Penske Motorsport
662 km36
20246 Hours of the Americas#83 Ferrari
Ferrari AF Corse
1,009 km36
20206 Hours of the Americas#1 Rebellion
Rebellion Racing
1,042 km30
20176 Hours of the Americas#2 Porsche
Porsche LMP Team
1,058 km26
20166 Hours of the Americas#1 Porsche
Porsche Team
1,025 km31
20156 Hours of the Americas#17 Porsche
Porsche Team
1,020 km31
20146 Hours of the Americas#2 Audi
Audi Sport Team Joest
866 km29
20136 Hours of the Americas#2 Audi
Audi Sport Team Joest
1,031 km28

All-time WEC records · every WEC season in data