

Toyota won the 8 Hours of Bahrain 2020 at Bahrain International Circuit. The #7 Toyota TS050 Hybrid of Toyota Gazoo Racing covered 263 laps over 8 hours, a race distance of 1,423 km. The winning crew: Mike Conway, Kamui Kobayashi and Jose Maria Lopez. The margin to second place was 0 laps — a clear, controlled win. The fastest manufacturer also produced the winner.
How the Lead Was Won
Across the race we counted 0 lead changes among 1 different car in the LMP1 class. At the closest point, first and second were only 10.9 s apart. For 2 of 5 measured hours the gap stayed under 30 seconds.
The leader was never fully out of reach, but the pressure came in waves rather than all race long.
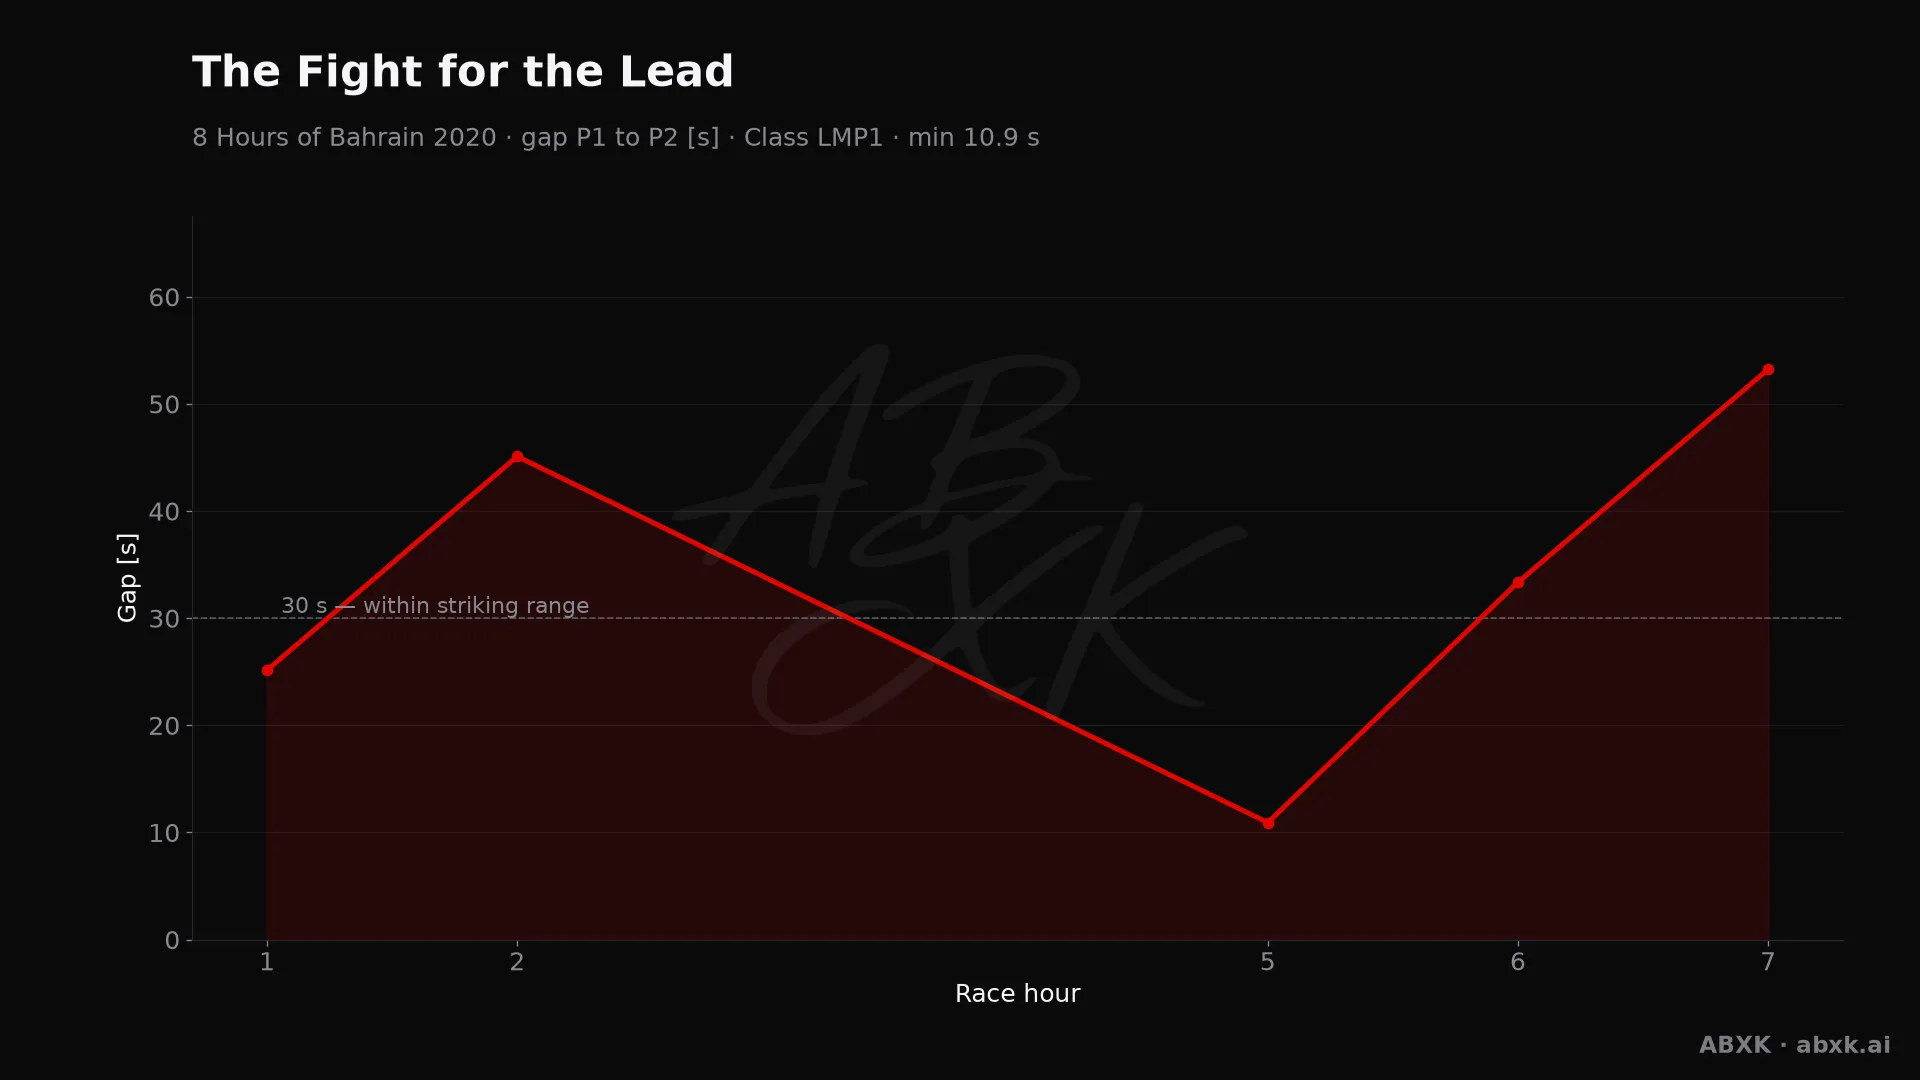
Figure 1 shows how that gap moved over the distance.
Who Went the Distance
The official result lists every starter as classified, so it does not mark retirements. We therefore measure how far each car actually got: a car counts as having gone the distance when it completed at least 95 % of its class winner’s laps.
By that measure 21 of 22 cars went the distance (96%). LMGTE Pro held up best at 100%, LMP2 worst at 83%. On average, a car covered 99% of the winning distance.
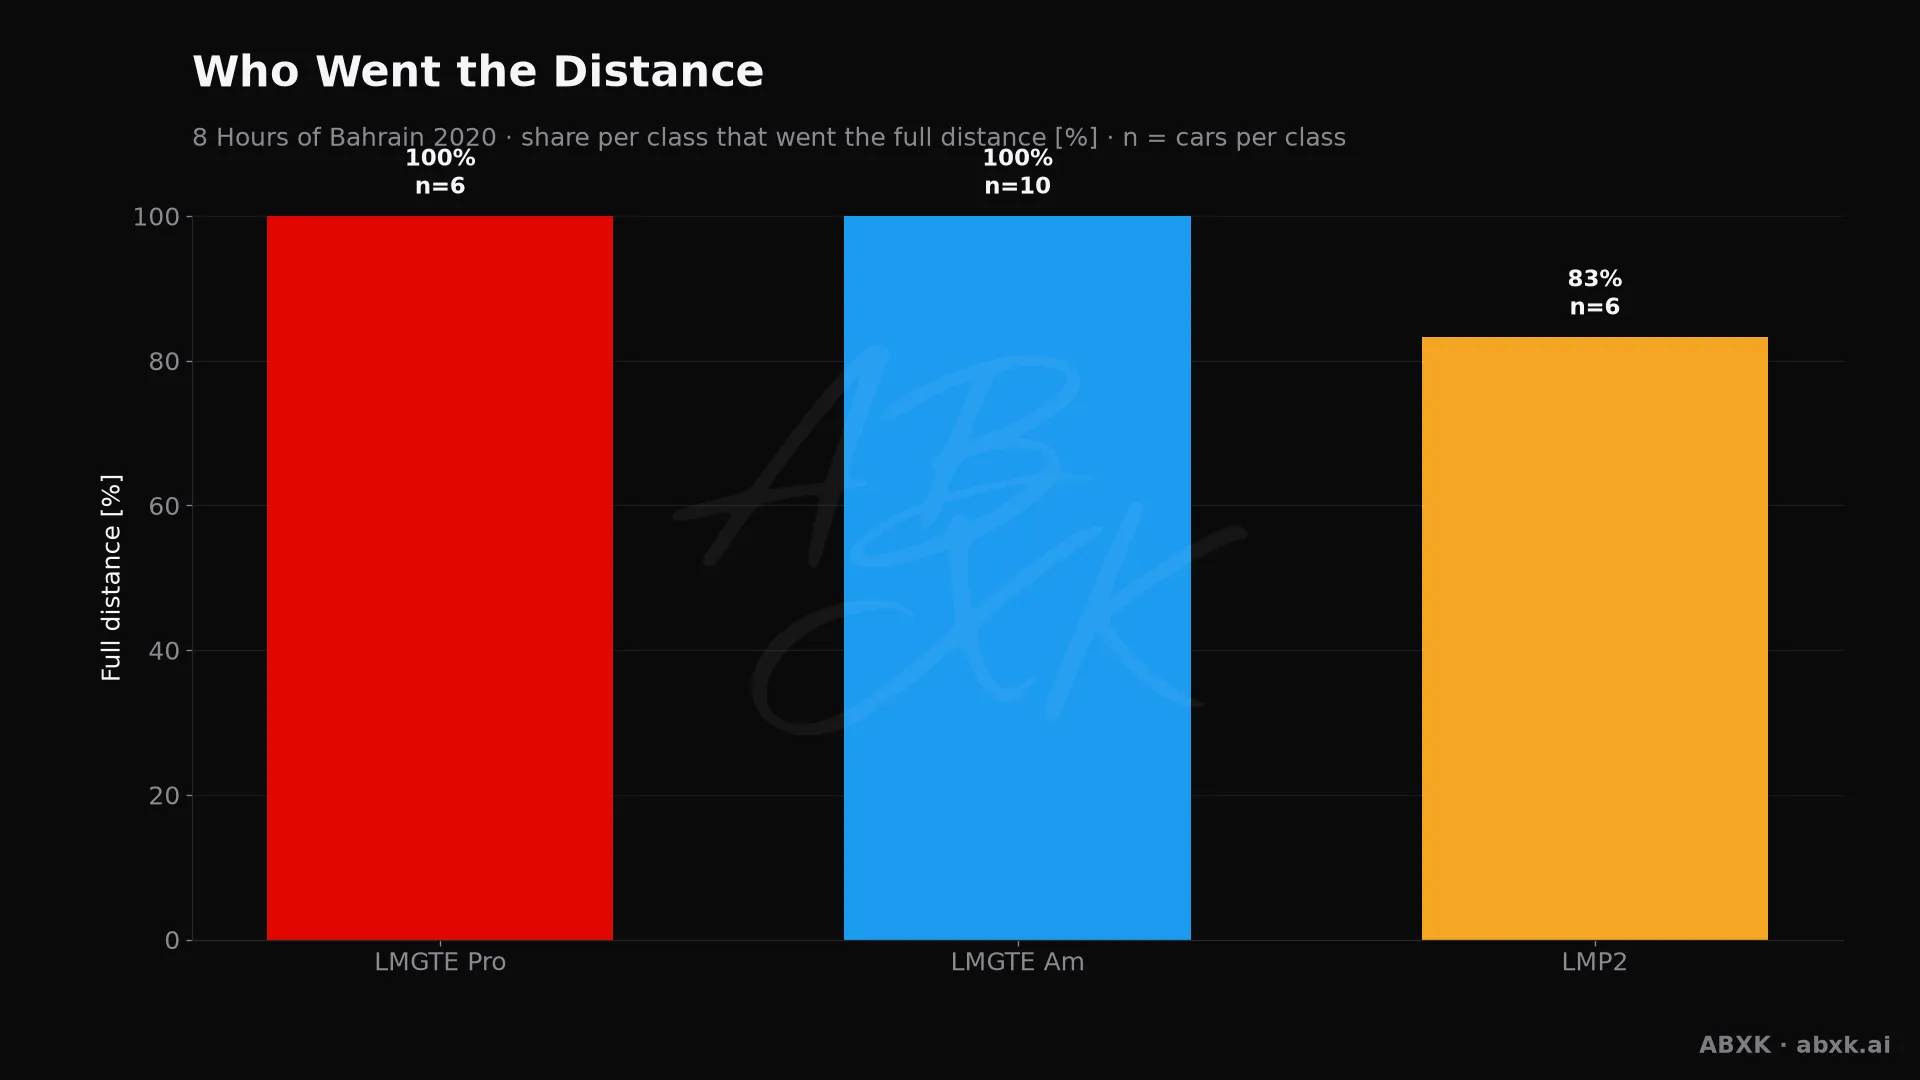
Figure 2 compares the classes directly.
The Closing Phase
In the final hour, 46% of the field held position within ±1 place (n = 24). The closing hour stayed busy, with position changes across the field. The biggest single move came from #47 Dallara, 16 places back.
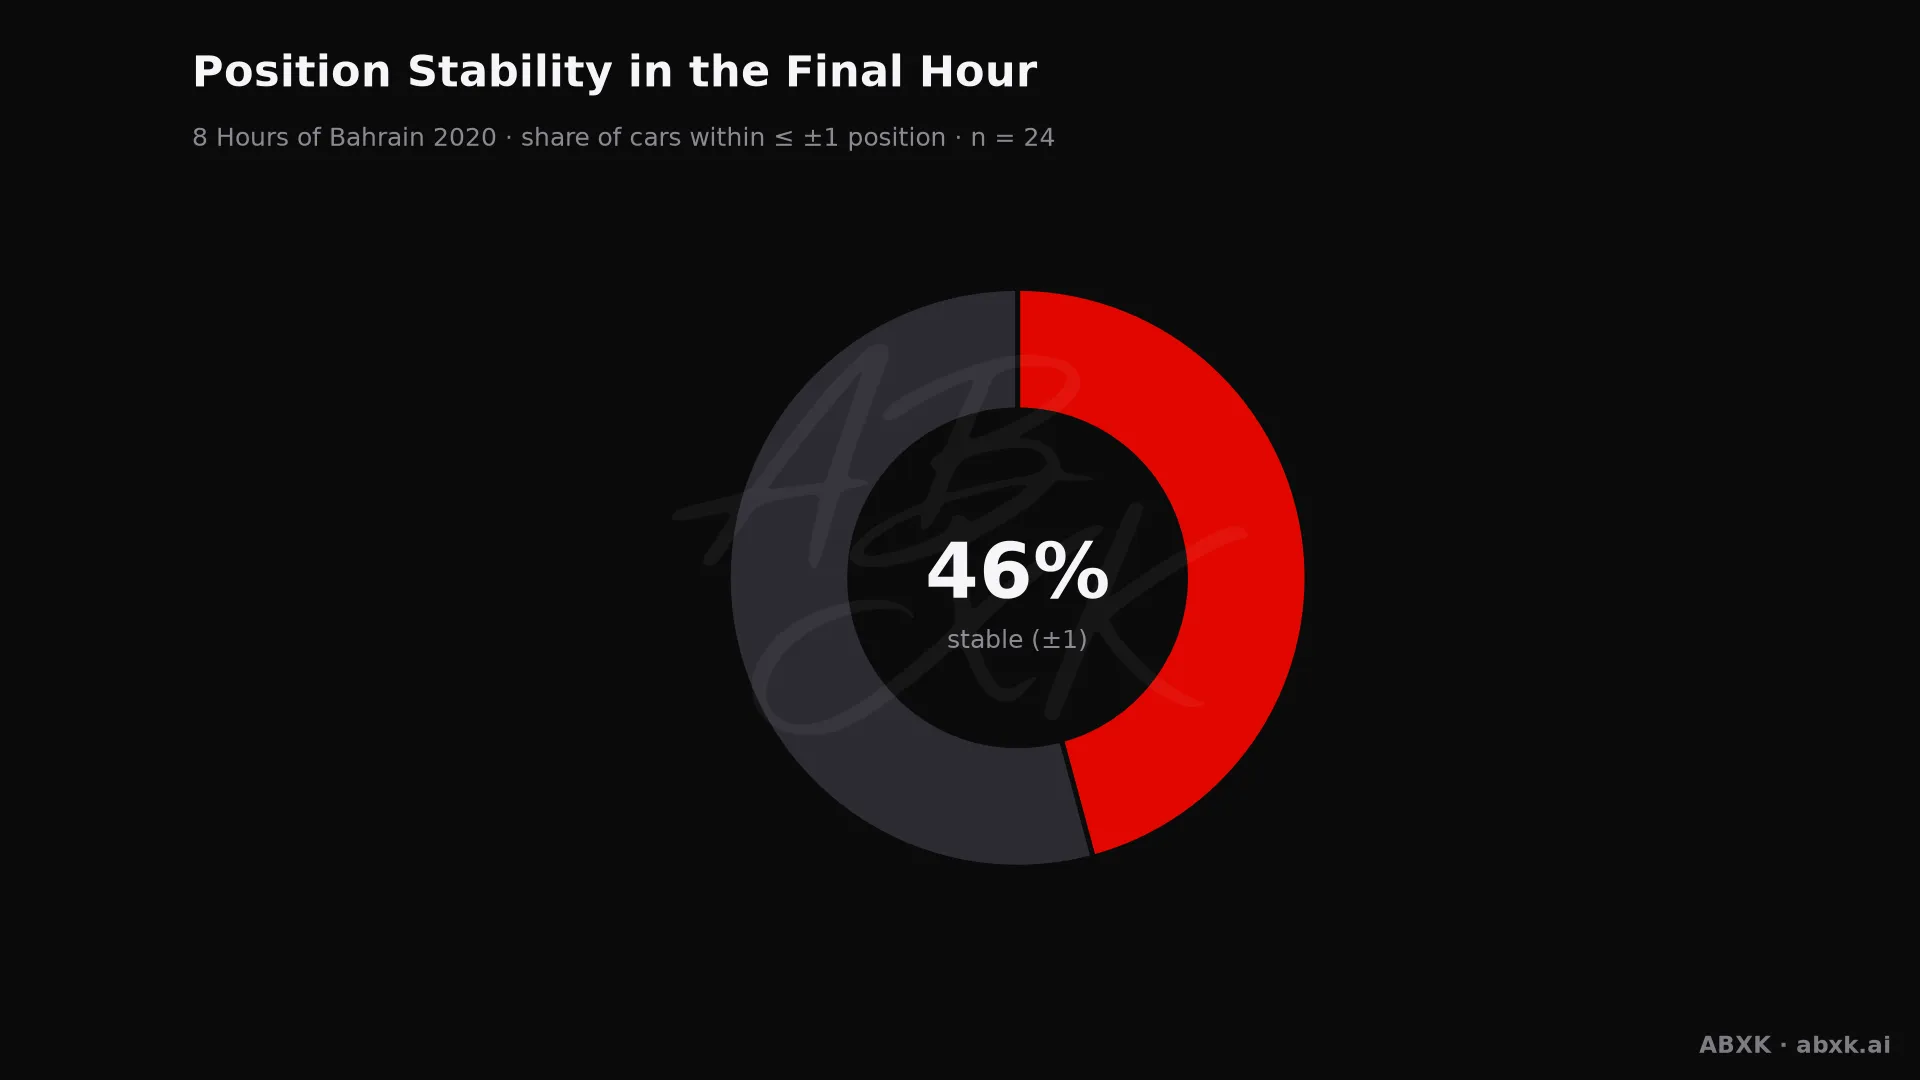
Figure 3 shows how settled the finish really was.
Fastest Lap and Class Gaps
The fastest single lap of the race belongs to #7 Toyota (Toyota Gazoo Racing): 1:42.637 at 189.8 km/h. Crew: Mike Conway, Kamui Kobayashi and Jose Maria Lopez.
Between LMP1 and LMP2 sits a pace gap of 6.9 s per lap. That number decides how much traffic the leaders have to work through.
Class winners — LMP1: #7 Toyota (Toyota Gazoo Racing), LMP2: #37 Oreca (Jackie Chan DC Racing), LMGTE Pro: #92 Porsche (Porsche GT Team), LMGTE Am: #56 Porsche (Team Project 1).
Putting the Race in Context
The winner averaged 177.8 km/h across 1,423 km. On a 5.412 km lap, that is the pace the whole strategy had to sustain.
We calculate the same metrics for every race in the archive: pace order, reliability by class, lead changes, winning margin, closing stability and efficiency. That makes this race directly comparable with every other round of the 2019-2020 season — and with the seasons before it.
All figures are derived from the full classification of every race hour and are recalculated with each build.

