
Motorsport Data & AI · 6 Hours of Shanghai 2016 · Season 2016

6 Hours of Shanghai 2016 — AI Data Analysis

Toyota wins the 6 Hours of Shanghai 2016 with the #6 Toyota TS050 Hybrid. Pace order, reliability by class, lead changes and the closing phase in a data check.

#6Winner · Toyota
244Laps led
32Cars total
5 hanalyzed

Winning crew · #6 Toyota Gazoo RacingStéphane Sarrazin · Mike Conway · Kamui Kobayashi

Toyota won the 6 Hours of Shanghai 2016 at Shanghai International Circuit. The #6 Toyota TS050 Hybrid of Toyota Gazoo Racing covered 244 laps over 6 hours, a race distance of 1,330 km. The winning crew: Stéphane Sarrazin, Mike Conway and Kamui Kobayashi. The margin to second place was just 1.439 s — a sprint finish after a full endurance race. The quickest manufacturer over one lap was Audi — but the win went to Toyota. Pace and result do not always match.

How the Lead Was Won

Across the race we counted 1 lead change among 2 different cars in the LMP1 class. At the closest point, first and second were only 1.4 s apart. For 5 of 5 measured hours the gap stayed under 30 seconds.

That is a real head-to-head fight, not a comfortable lead.
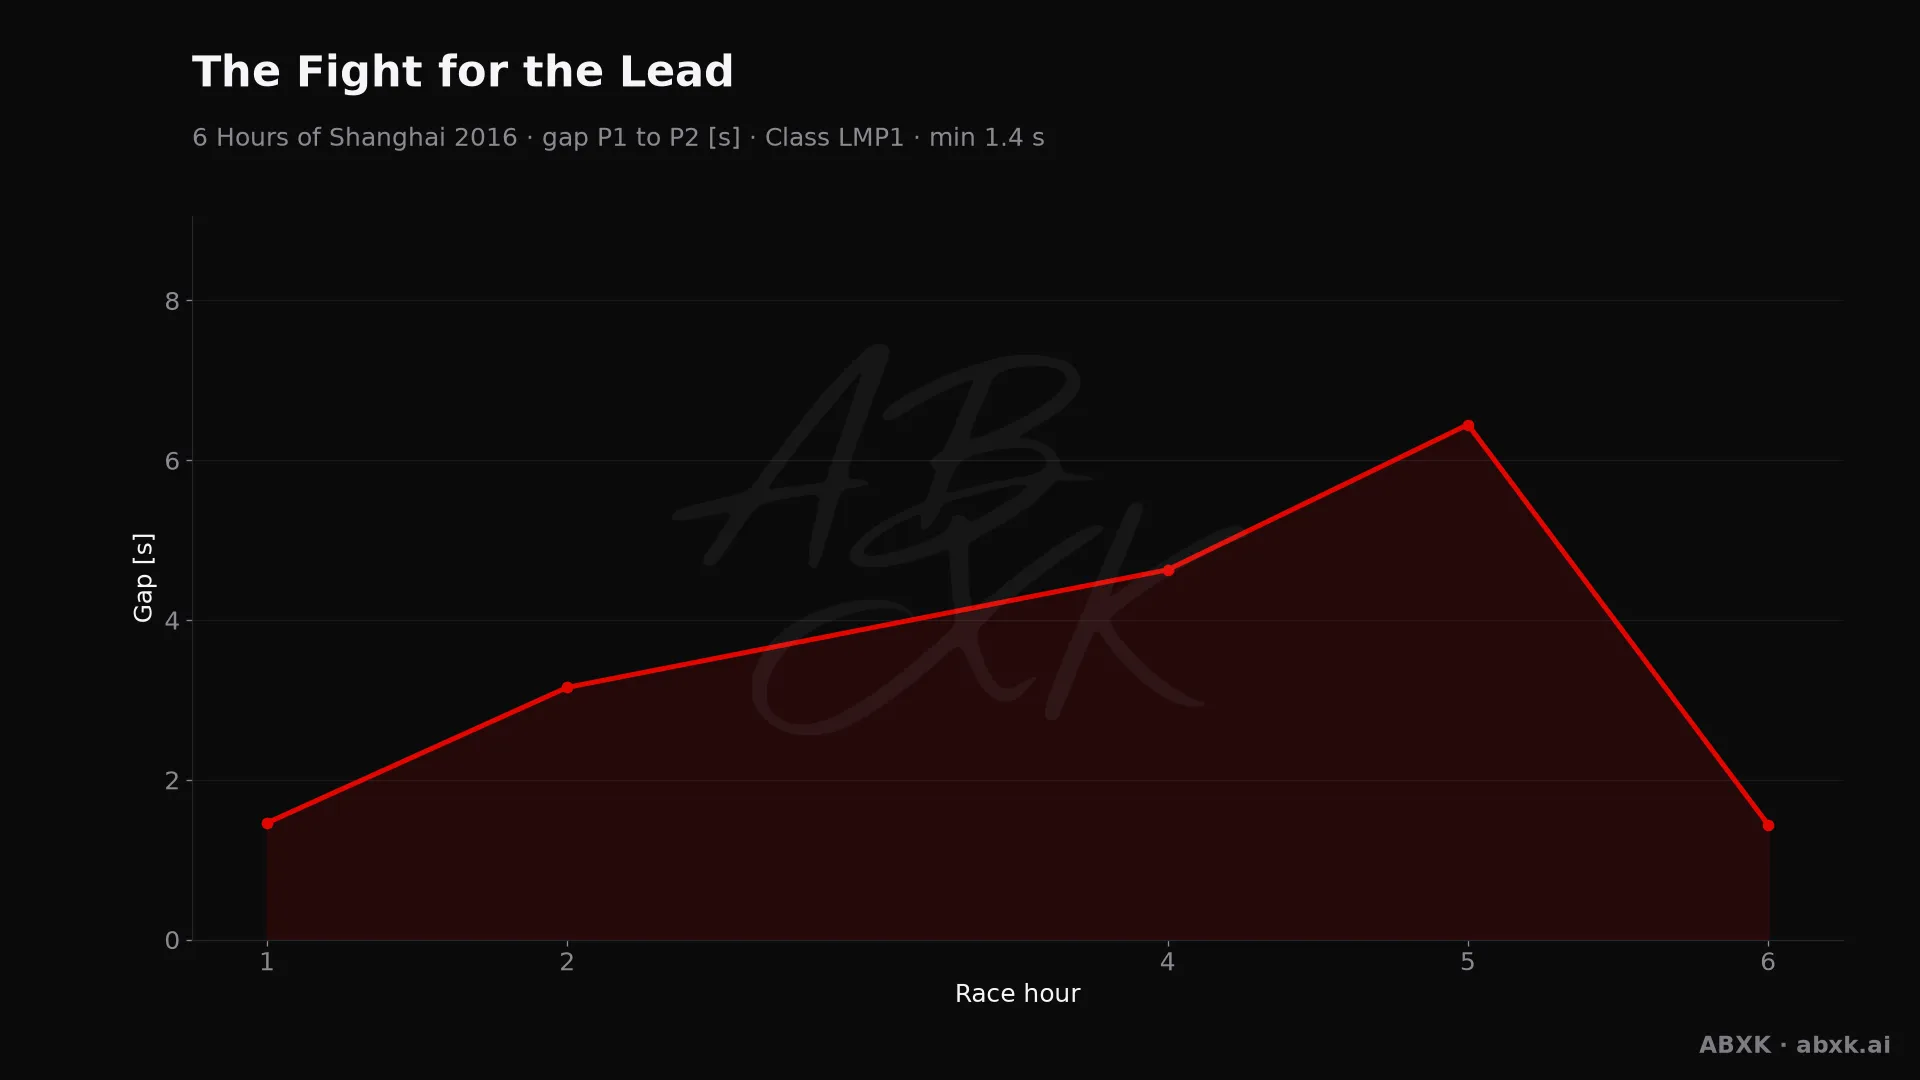
Gap between first and second in the LMP1 class, hour by hour. Peaks mark pit stops, safety cars and incidents.
Figure 1 — Gap between first and second in the LMP1 class, hour by hour. Peaks mark pit stops, safety cars and incidents.

Figure 1 shows how that gap moved over the distance.

Manufacturer Pace

We rank pace by the average of each manufacturer’s fastest lap. That measures real speed over the distance instead of one lucky lap. The order at the top: Audi (193.2 km/h), Toyota (192.4 km/h), Porsche (192.4 km/h).

Between the fastest and the slowest manufacturer in the LMP1 class lie 11.9 km/h. That is a wide spread. At this track, the concept differences show clearly.
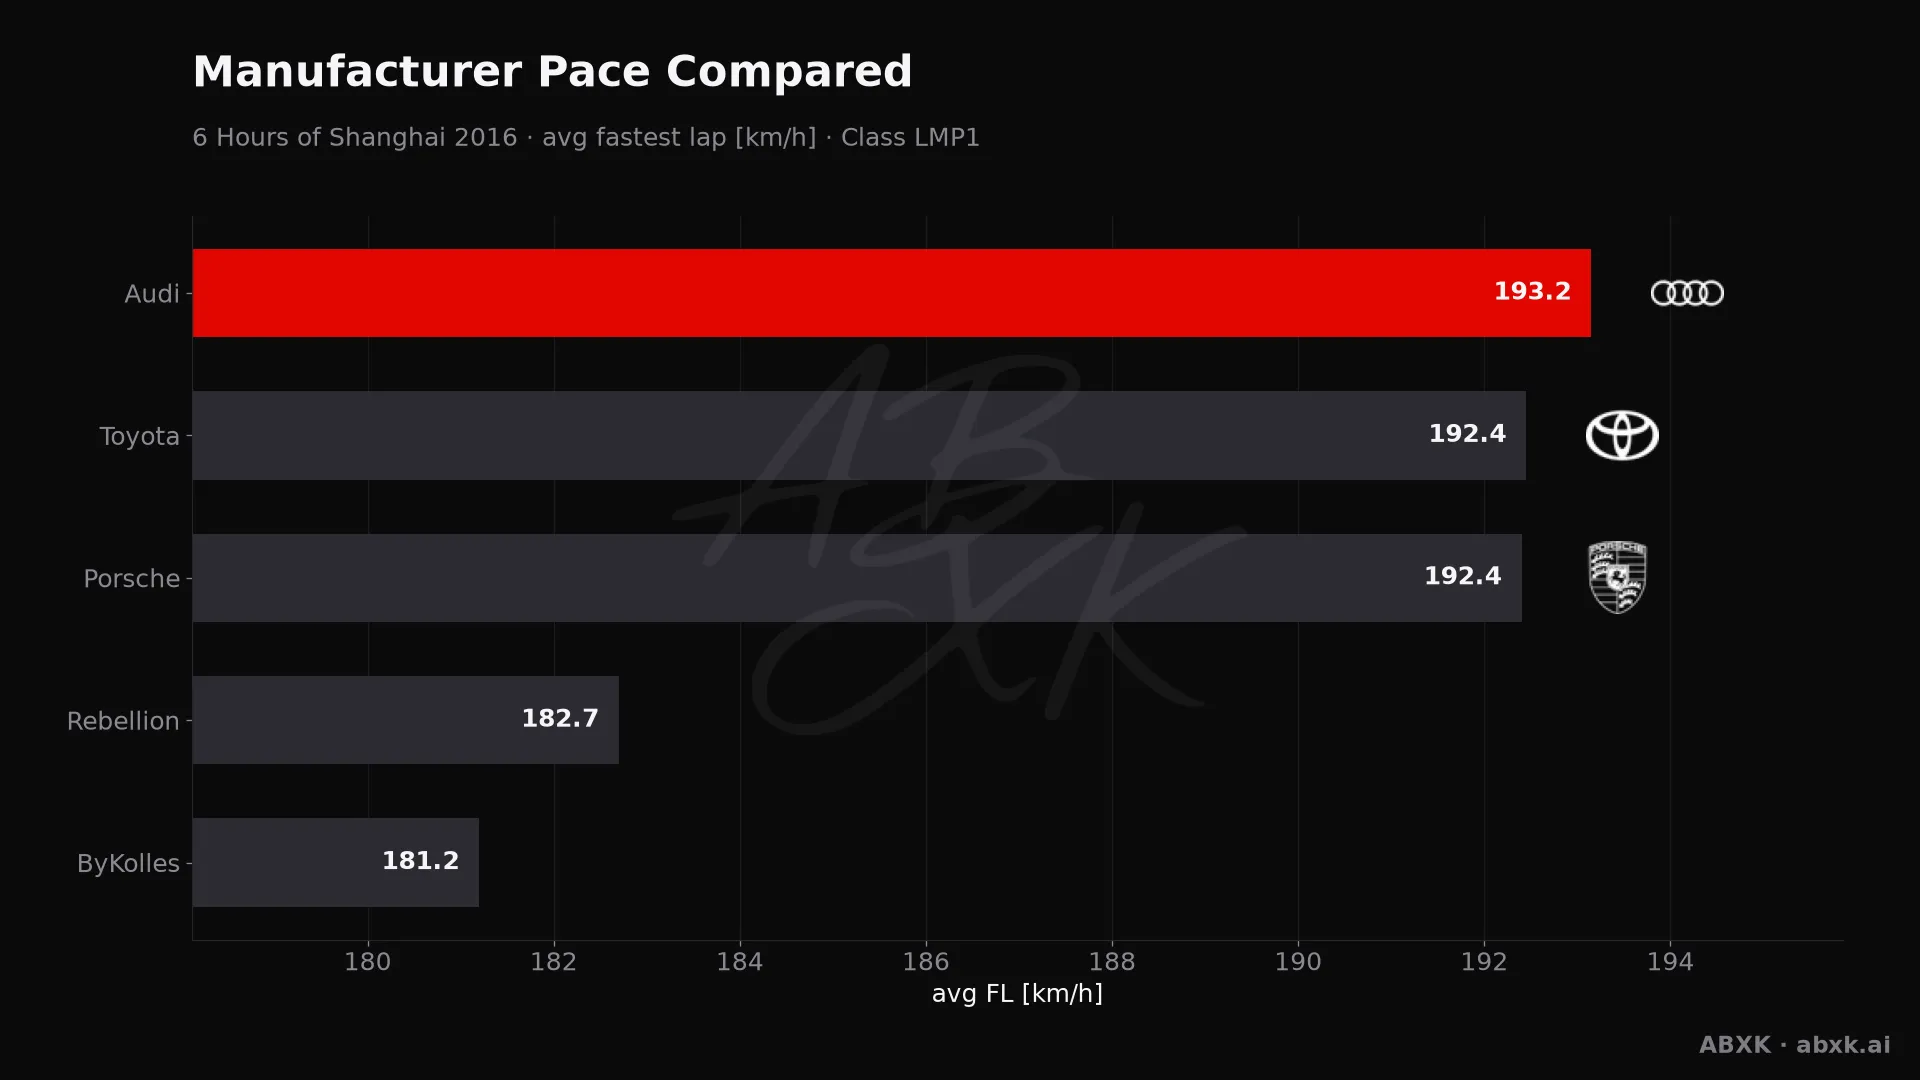
Average fastest lap speed per manufacturer in the LMP1 class. Higher is faster.
Figure 2 — Average fastest lap speed per manufacturer in the LMP1 class. Higher is faster.

Figure 2 sets the pace order side by side.

Reliability by Class

2 of 32 cars did not make the finish — an overall retirement rate of 6%. The heaviest toll fell on LMP1 with 25%, while LMGTE Am came through best at 0%.

Over this distance, reliability is a result in itself. A car that stops scores nothing, no matter how fast it was.
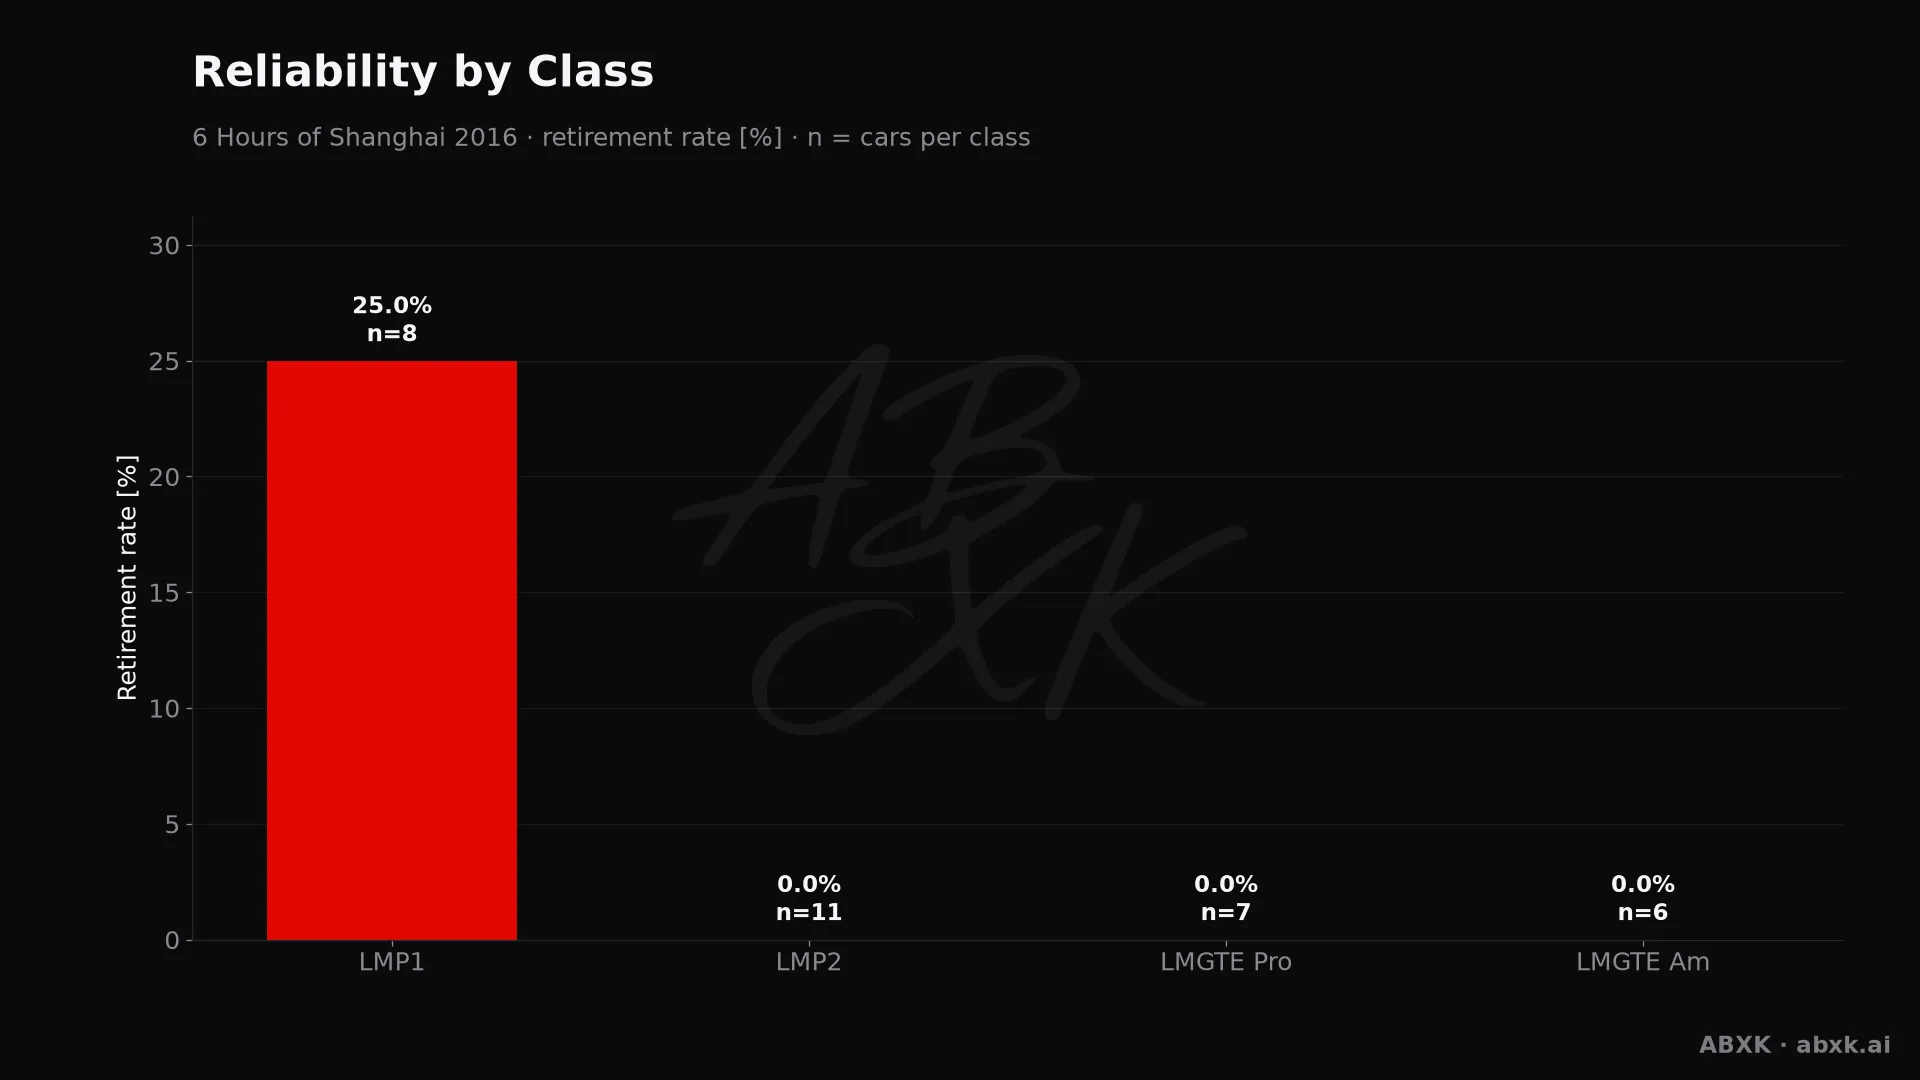
Retirement rate per class, with the number of entries behind each bar.
Figure 3 — Retirement rate per class, with the number of entries behind each bar.

Figure 3 compares the classes directly.

Efficiency Over the Distance

Our efficiency score multiplies average lap speed by laps completed and compares that to the class average. It rewards cars that were fast and stayed out of trouble. A value of 1.000 is exactly class average.

The top score goes to #8 Audi with 1.271. The winner, #6, is not on top here. Track position and strategy turned into a result that raw efficiency alone does not explain.
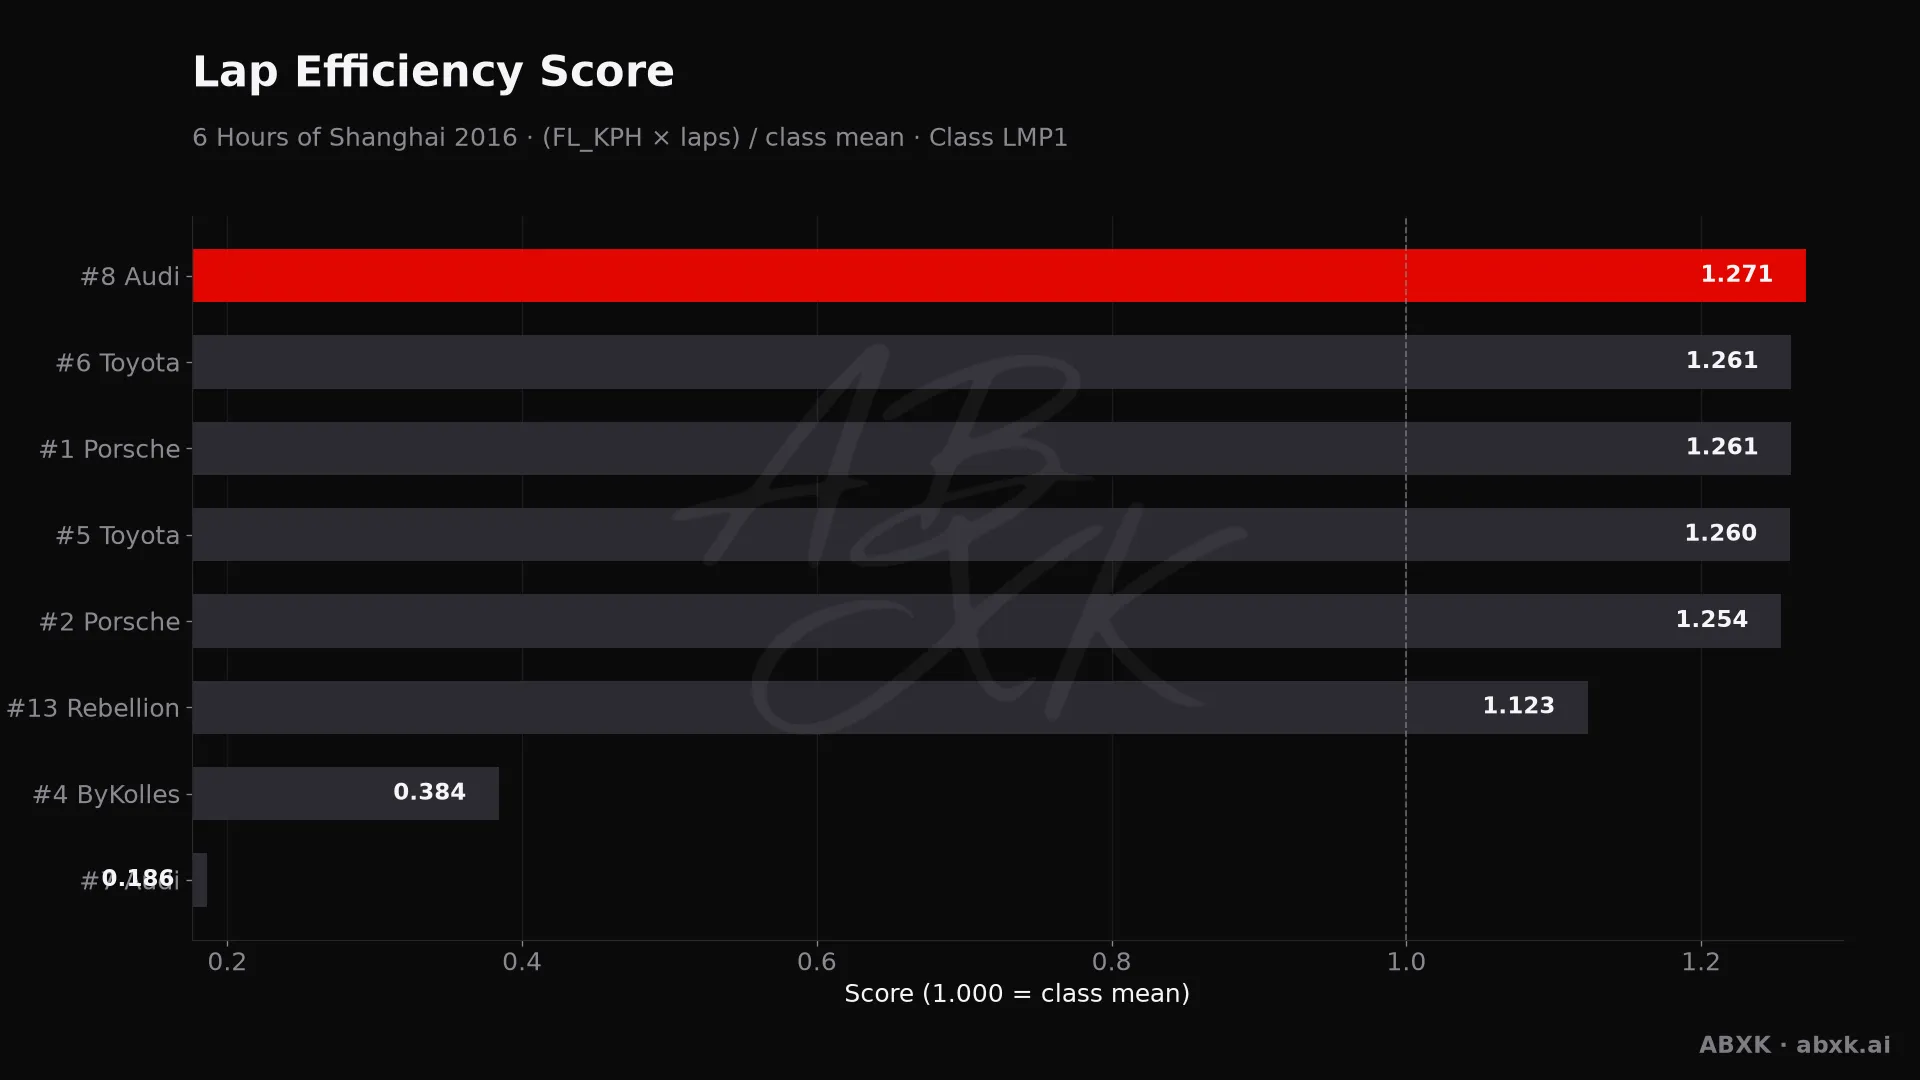
Efficiency score per car: average lap speed times laps, normalized to the class average.
Figure 4 — Efficiency score per car: average lap speed times laps, normalized to the class average.

Figure 4 ranks the cars by that score.

The Closing Phase

In the final hour, 94% of the field held position within ±1 place (n = 32). The race was settled well before the flag. The biggest single move came from #27 BR Engineering, 3 places back.
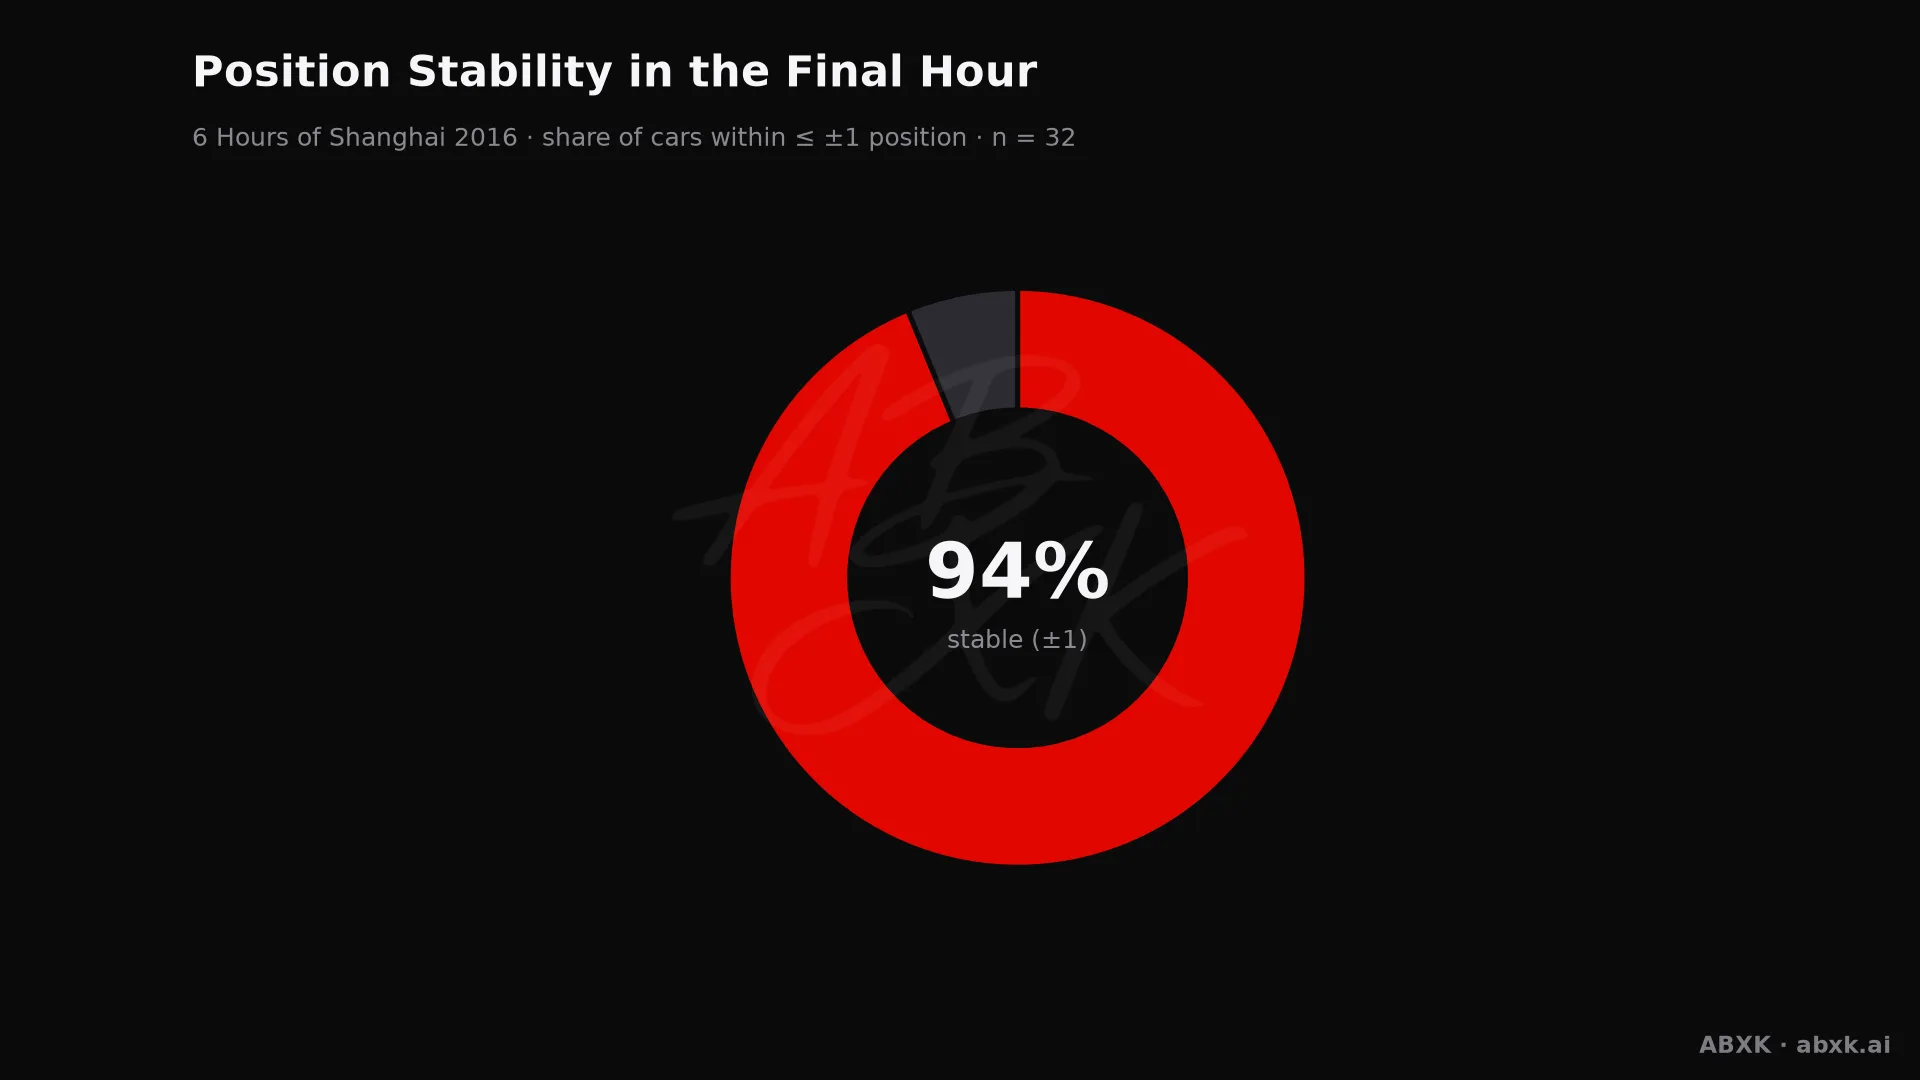
Share of cars that changed position by no more than one place in the final hour.
Figure 5 — Share of cars that changed position by no more than one place in the final hour.

Figure 5 shows how settled the finish really was.

Fastest Lap and Class Gaps

The fastest single lap of the race belongs to #8 Audi (Audi Sport Team Joest): 1:24.645 at 194.1 km/h. Crew: Lucas di Grassi, Loïc Duval and Oliver Jarvis.

Between LMP1 and LMP2 sits a pace gap of 6.9 s per lap. That number decides how much traffic the leaders have to work through.

Class winners — LMP1: #6 Toyota (Toyota Gazoo Racing), LMP2: #26 Oreca (G-Drive Racing), LMGTE Pro: #67 Ford (Ford Chip Ganassi Team UK), LMGTE Am: #98 Aston Martin (Aston Martin Racing).

Putting the Race in Context

The winner averaged 221.3 km/h across 1,330 km. On a 5.451 km lap, that is the pace the whole strategy had to sustain.

We calculate the same metrics for every race in the archive: pace order, reliability by class, lead changes, winning margin, closing stability and efficiency. That makes this race directly comparable with every other round of the 2016 season — and with the seasons before it.

All figures are derived from the full classification of every race hour and are recalculated with each build.

Overall result LMP1

Full final classification of the top class after 5 hours — car, driver crew, laps, gap, fastest race lap and average pace.

Overall result
PosNoManufacturer / CarTeam & DriversLapsGapFastest lapØ FL km/h
1#6ToyotaToyotaToyota TS050 HybridToyota Gazoo RacingStéphane Sarrazin · Mike Conway · Kamui Kobayashi2441:25.320192.5
2#8AudiAudiAudi R18Audi Sport Team JoestLucas di Grassi · Loïc Duval · Oliver Jarvis244+1.4391:24.645194.1
3#1PorschePorschePorsche 919 HybridPorsche TeamTimo Bernhard · Mark Webber · Brendon Hartley244+17.3391:25.311192.6
4#5ToyotaToyotaToyota TS050 HybridToyota Gazoo RacingAnthony Davidson · Sébastien Buemi · Kazuki Nakajima244+53.7791:25.377192.4
5#2PorschePorschePorsche 919 HybridPorsche TeamRomain Dumas · Neel Jani · Marc Lieb243+1 Laps1:25.473192.2
6#13RebellionRebellion R-OneRebellion RacingMathéo Tuscher · Dominik Kraihamer · Alexandre Imperatori229+15 Laps1:29.901182.7
31#4ByKollesENSO CLM P1/01Bykolles Racing TeamSimon Trummer · Oliver Webb · Pierre Kaffer79+165 Laps Not classified1:30.658181.2
32#7AudiAudiAudi R18Audi Sport Team JoestMarcel Fässler · André Lotterer · Benoît Tréluyer36+208 Laps Not classified1:25.476192.2

Season context: the full 2016 WEC season in data · all-time WEC records

Class winners in detail

The winners of each class with overall position, car, crew and fastest lap.

Class winners in detail
ClassOverallNoManufacturer / CarTeam & DriversLapsFastest lap
LMP1P1#6ToyotaToyotaToyota TS050 HybridToyota Gazoo RacingStéphane Sarrazin · Mike Conway · Kamui Kobayashi2441:25.320
LMP2P7#26OrecaOreca 05G-Drive RacingRoman Rusinov · Alex Brundle · Will Stevens2231:33.011
LMGTE ProP17#67FordFordFord GT GTEFord Chip Ganassi Team UKAndy Priaulx · Harry Tincknell2121:38.575
LMGTE AmP24#98Aston MartinAston MartinAston Martin V8 Vantage GTEAston Martin RacingPaul Dalla Lana · Pedro Lamy · Mathias Lauda2081:40.052

Manufacturer pace

Average of the fastest lap speed per manufacturer. It measures real pace over the distance, not a single outlier.

Audi
193.15
Toyota
192.45
Porsche
192.4

Reliability by class

Retirement rate per class — the toughest filter of a long-distance race.

LMGTE Am
0% · n6
LMGTE Pro
0% · n7
LMP1
25% · n8
LMP2
0% · n11

Lap efficiency score

(avg FL km/h × laps) normalized to the class mean. It combines pace, distance and durability in one number — 1.000 = class mean.

#8 Audi
1.271
#6 Toyota
1.261
#1 Porsche
1.261
#5 Toyota
1.260
#2 Porsche
1.254
#13 Rebellion
1.123
#4 ByKolles
0.384
#7 Audi
0.186

Position stability, final hour

Share of cars that held their position within ±1 in the final hour (n=32).

94%

The race was decided early — the closing phase brought barely any movement.

Race dynamics compared

The same metrics for every race — so Le Mans is directly comparable with Daytona, and year with year.

1Lead changes (2 leaders)
1.439Winning margin over P2
6.9 sPace delta LMP1 → LMP2
LMP1top class analyzed
1.4 sClosest lead gap
5/5Hours inside 30 s
1,330 kmWinning distance
221.3Average speed km/h
130Position changes total
88Drivers in the field

Fastest race lap

The quickest single lap of the whole race — peak pace, not race pace.

1:24.645 · 194.1 km/h — #8 Audi, Audi Sport Team Joest (LMP1)
Lucas di Grassi · Loïc Duval · Oliver Jarvis

Steadiest cars

Laps per hour and their spread. A low spread means few stops, few incidents, a clean rhythm.

NoManufacturerLaps/hSpread
#8Audi40.67±0.47
#6Toyota40.67±0.47
#1Porsche40.67±0.47
#5Toyota40.67±0.47
#13Rebellion38.33±0.47
#2Porsche40.33±0.94

WEC record at this circuit

The World Endurance Championship has raced here 8 times in the seasons we analyze, and Toyota has won most often (5). Every entry links to the full data analysis of that race.

Fastest lap on record
1:24.645 · 194.1 km/h
#8 Audi, Audi Sport Team Joest (2016)
Highest race average
221.3 km/h
Toyota (2016)
Seasons
2012, 2013, 2014, 2015, 2016, 2017, 2018-2019, 2019-2020
WEC races at this circuit
YearRaceWinnerDistanceCars
20194 Hours of Shanghai#1 Rebellion
Rebellion Racing
681 km31
20186 Hours of Shanghai#7 Toyota
Toyota Gazoo Racing
616 km35
20176 Hours of Shanghai#8 Toyota
Toyota Gazoo Racing
1,063 km26
20166 Hours of Shanghai#6 Toyota
Toyota Gazoo Racing
1,330 km32
20156 Hours of Shanghai#17 Porsche
Porsche Team
921 km31
20146 Hours of Shanghai#8 Toyota
Toyota Gazoo Racing
1,025 km27
20136 Hours of Shanghai#1 Audi
Audi Sport Team Joest
1,036 km28
20126 Hours of Shanghai#7 Toyota
Toyota Gazoo Racing
1,041 km28

All-time WEC records · every WEC season in data