
Motorsport Data & AI · 6 Hours of Imola 2025 · Season 2025

6 Hours of Imola 2025 — AI Data Analysis

Ferrari wins the 6 Hours of Imola 2025 with the #51 Ferrari 499P. Pace order, reliability by class, lead changes and the closing phase in a data check.

#51Winner · Ferrari
212Laps led
36Cars total
6 hanalyzed

Winning crew · #51 Ferrari AF CorseAlessandro Pier Guidi · James Calado · Antonio Giovinazzi

Ferrari won the 6 Hours of Imola 2025 at Autodromo Enzo e Dino Ferrari. The #51 Ferrari 499P of Ferrari AF Corse covered 212 laps over 6 hours, a race distance of 1,041 km. The winning crew: Alessandro Pier Guidi, James Calado and Antonio Giovinazzi. The margin to second place was 8.5 s, close enough to keep the result open late. The fastest manufacturer also produced the winner.

How the Lead Was Won

Across the race we counted 3 lead changes among 3 different cars in the HYPERCAR class. At the closest point, first and second were only 0.2 s apart. For 6 of 6 measured hours the gap stayed under 30 seconds.

That is a real head-to-head fight, not a comfortable lead.
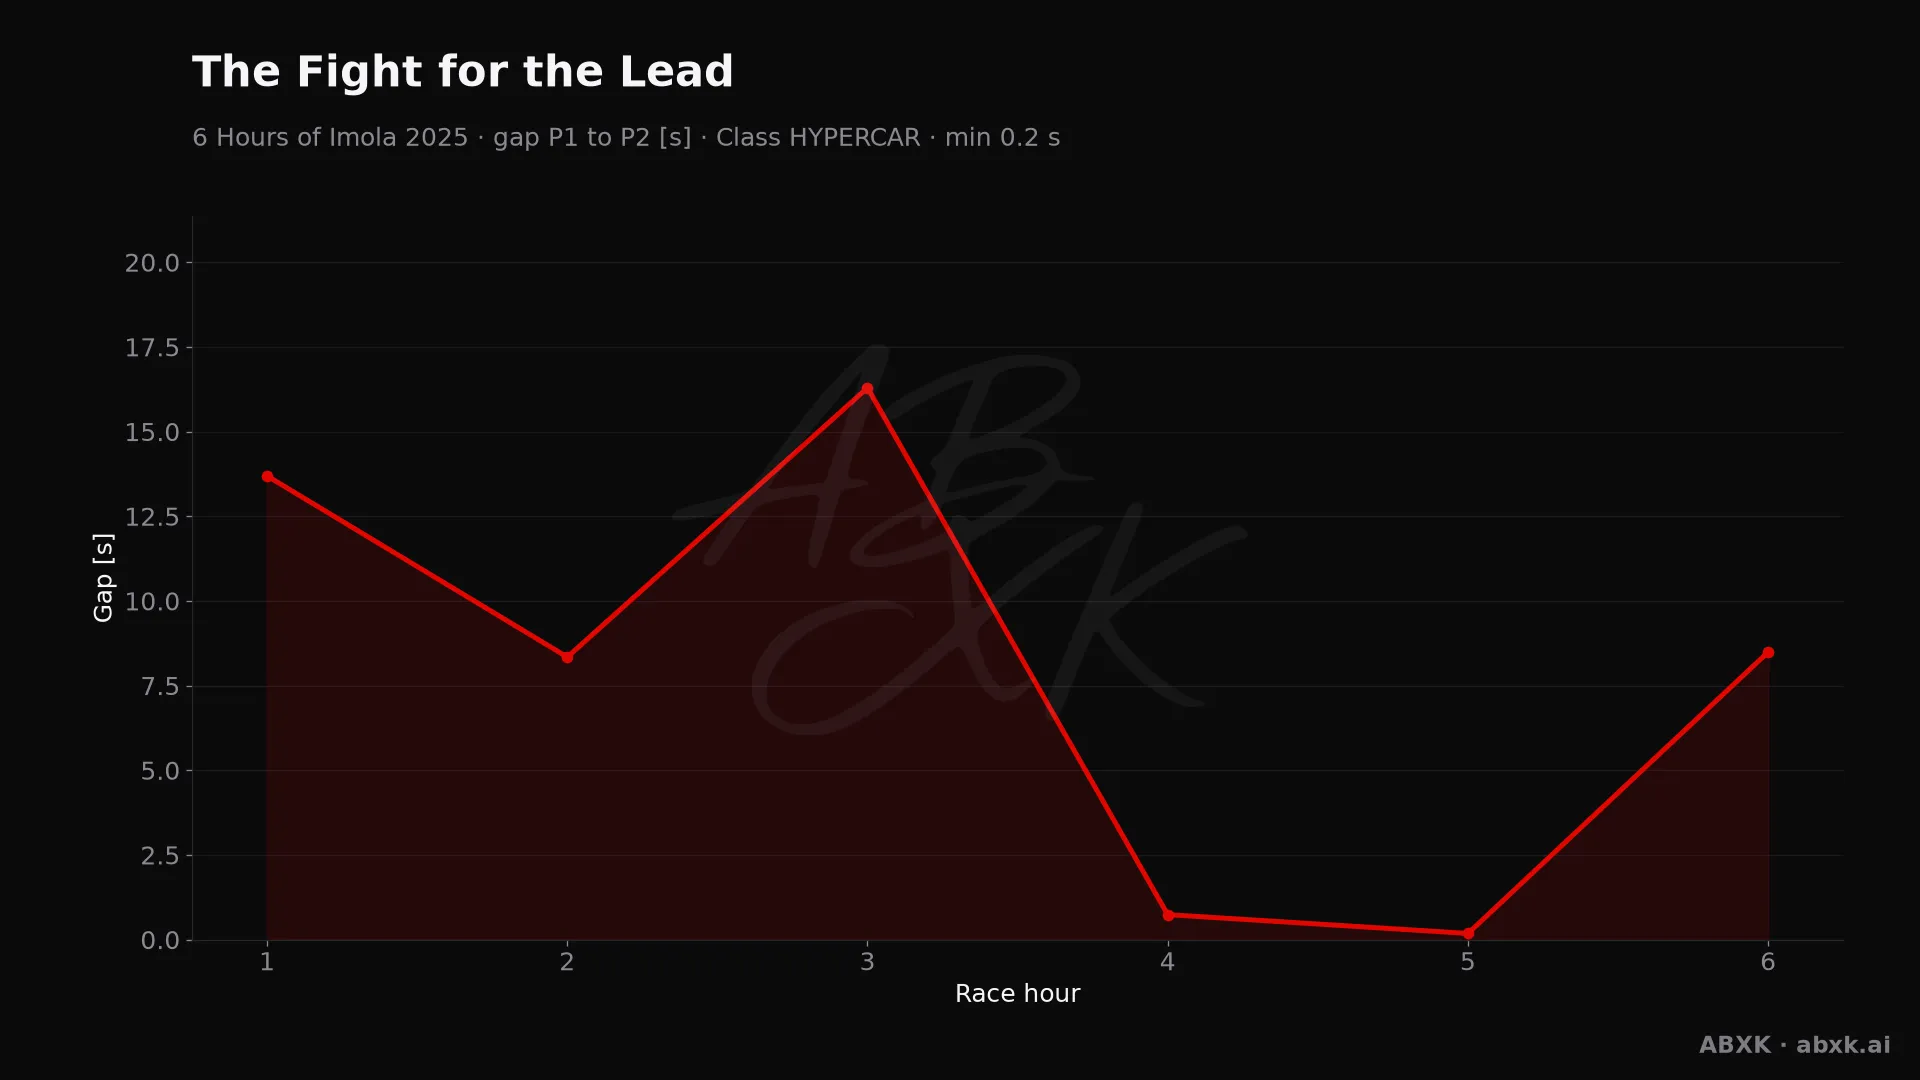
Gap between first and second in the HYPERCAR class, hour by hour. Peaks mark pit stops, safety cars and incidents.
Figure 1 — Gap between first and second in the HYPERCAR class, hour by hour. Peaks mark pit stops, safety cars and incidents.

Figure 1 shows how that gap moved over the distance.

Manufacturer Pace

We rank pace by the average of each manufacturer’s fastest lap. That measures real speed over the distance instead of one lucky lap. The order at the top: Ferrari (190.7 km/h), BMW (190.2 km/h), Toyota (190.2 km/h).

Between the fastest and the slowest manufacturer in the HYPERCAR class lie 3.6 km/h. That is a wide spread. At this track, the concept differences show clearly.
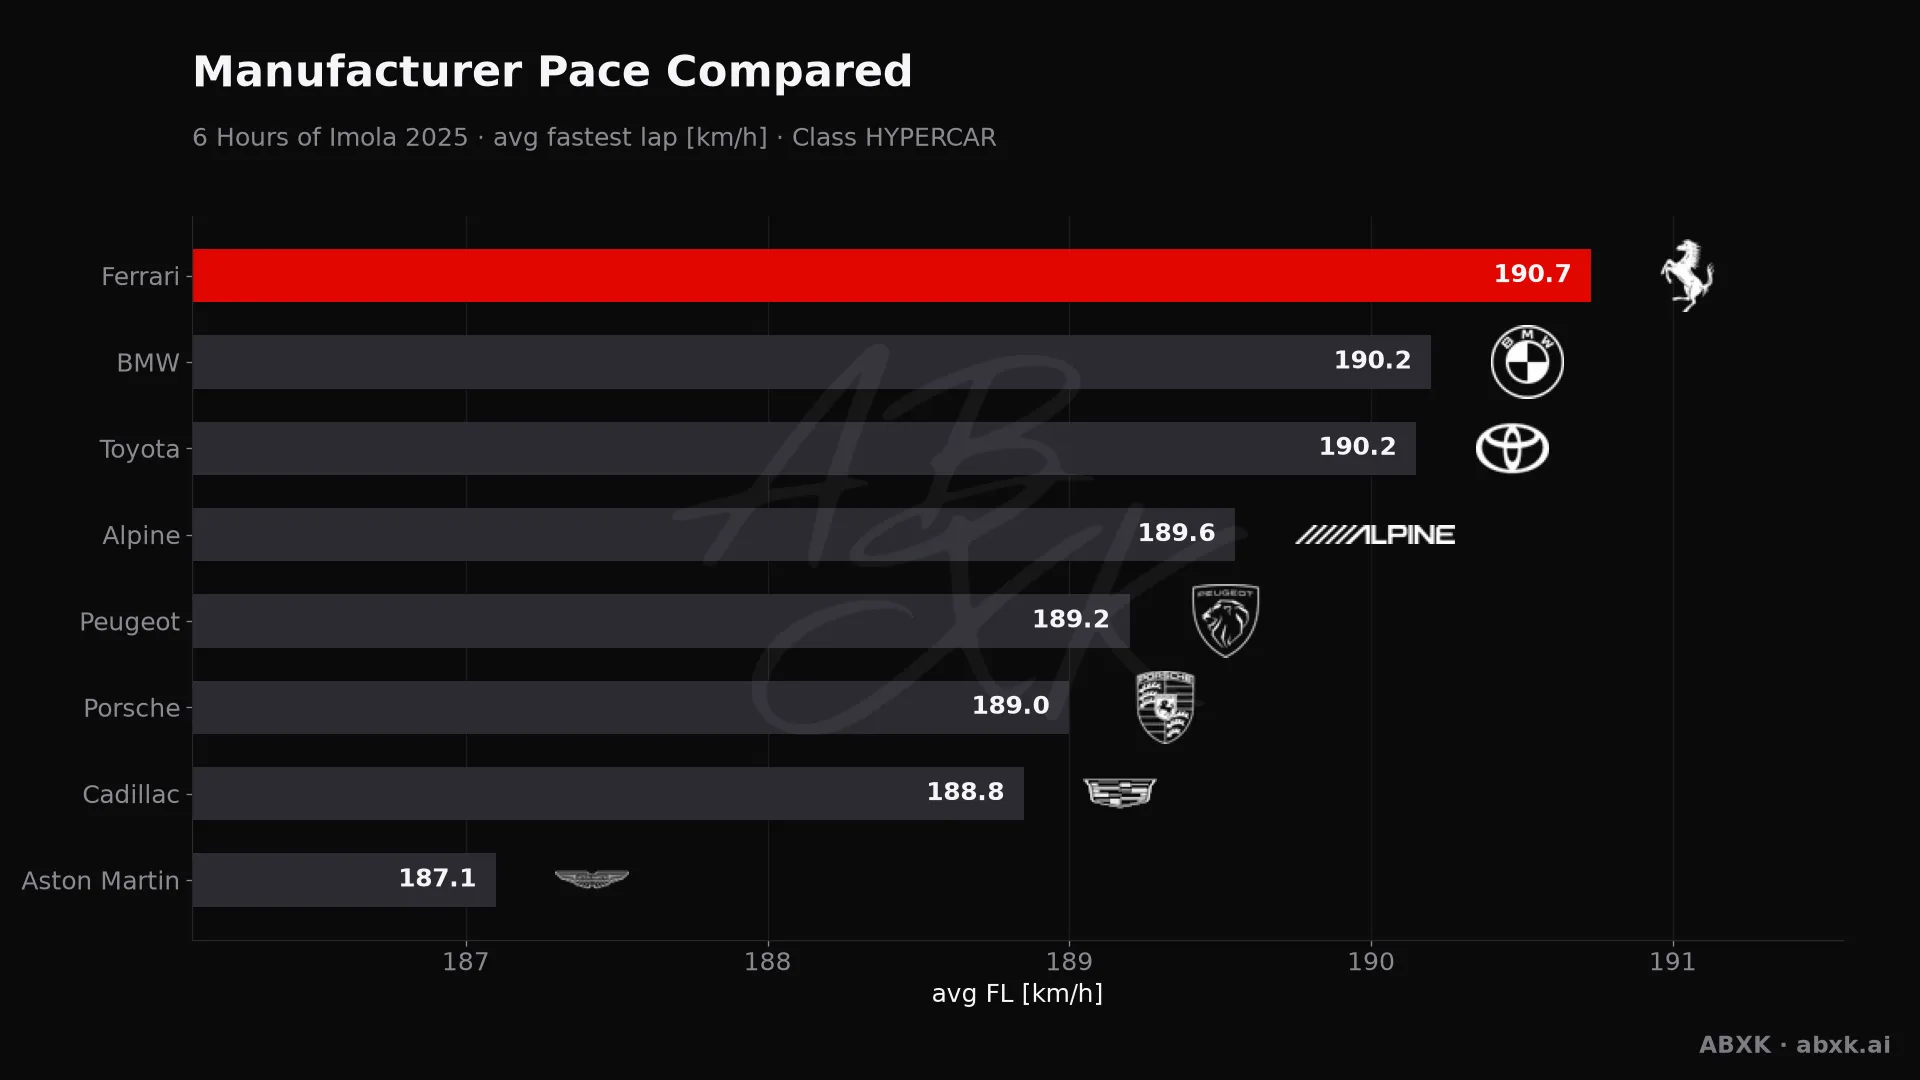
Average fastest lap speed per manufacturer in the HYPERCAR class. Higher is faster.
Figure 2 — Average fastest lap speed per manufacturer in the HYPERCAR class. Higher is faster.

Figure 2 sets the pace order side by side.

Reliability by Class

2 of 36 cars did not make the finish — an overall retirement rate of 6%. The heaviest toll fell on LMGT3 with 11%, while HYPERCAR came through best at 0%.

Over this distance, reliability is a result in itself. A car that stops scores nothing, no matter how fast it was.
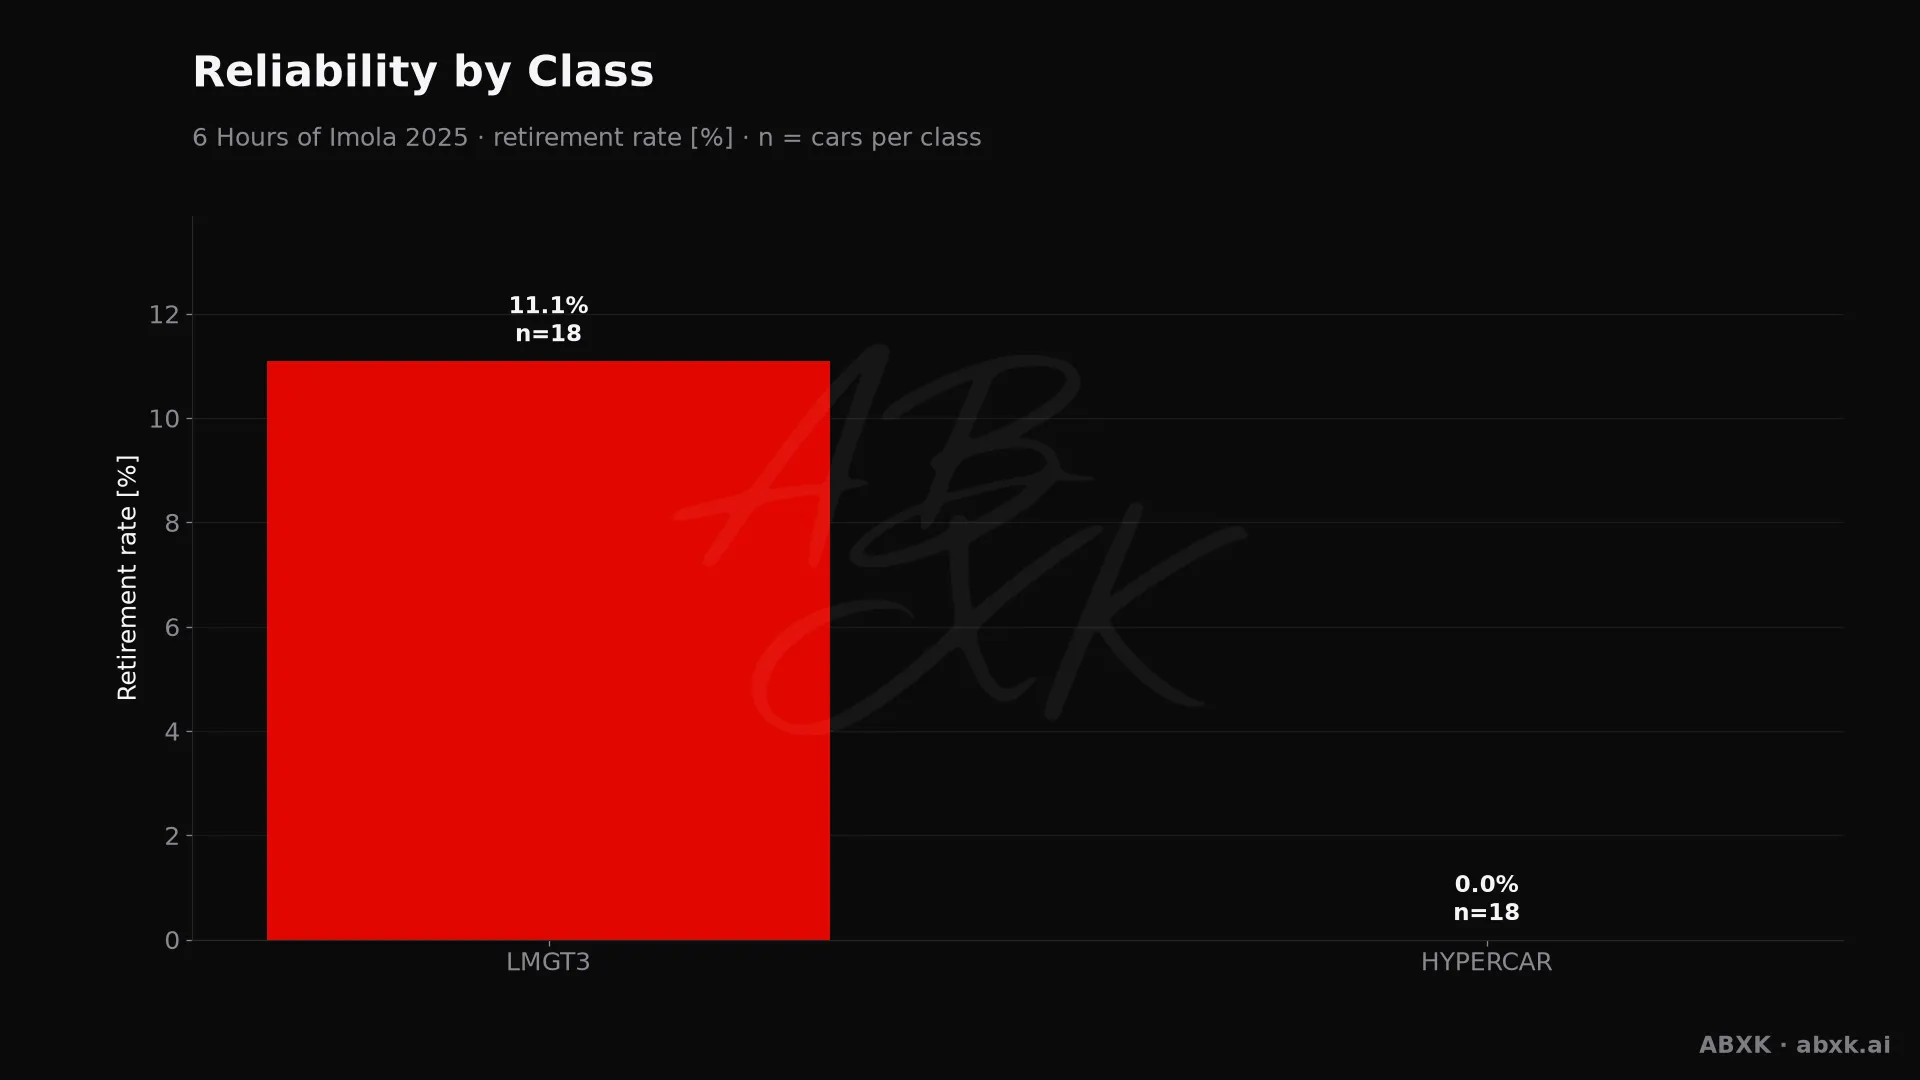
Retirement rate per class, with the number of entries behind each bar.
Figure 3 — Retirement rate per class, with the number of entries behind each bar.

Figure 3 compares the classes directly.

Efficiency Over the Distance

Our efficiency score multiplies average lap speed by laps completed and compares that to the class average. It rewards cars that were fast and stayed out of trouble. A value of 1.000 is exactly class average.

The top score goes to #51 Ferrari with 1.010. That is the winning car — speed and durability came from the same package.
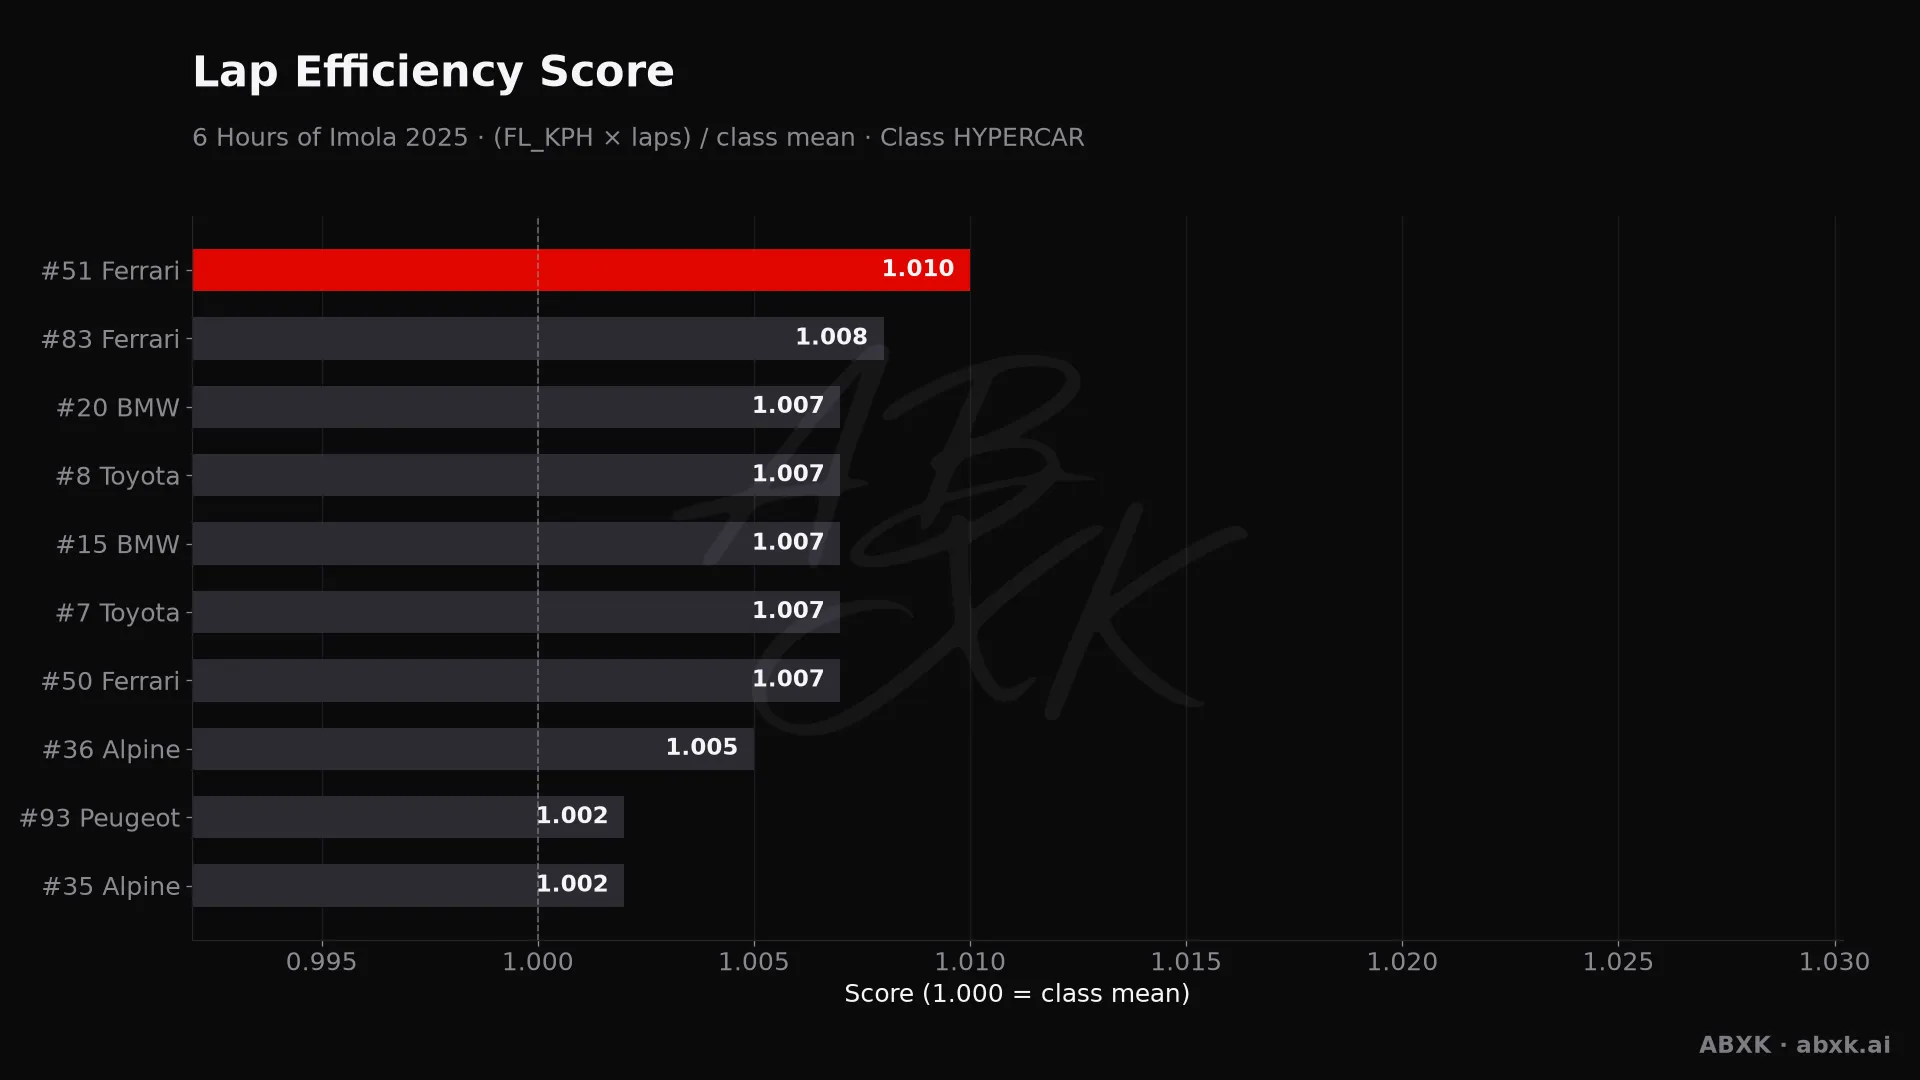
Efficiency score per car: average lap speed times laps, normalized to the class average.
Figure 4 — Efficiency score per car: average lap speed times laps, normalized to the class average.

Figure 4 ranks the cars by that score.

The Closing Phase

In the final hour, 58% of the field held position within ±1 place (n = 36). The closing hour stayed busy, with position changes across the field. The biggest single move came from #50 Ferrari, 13 places back.
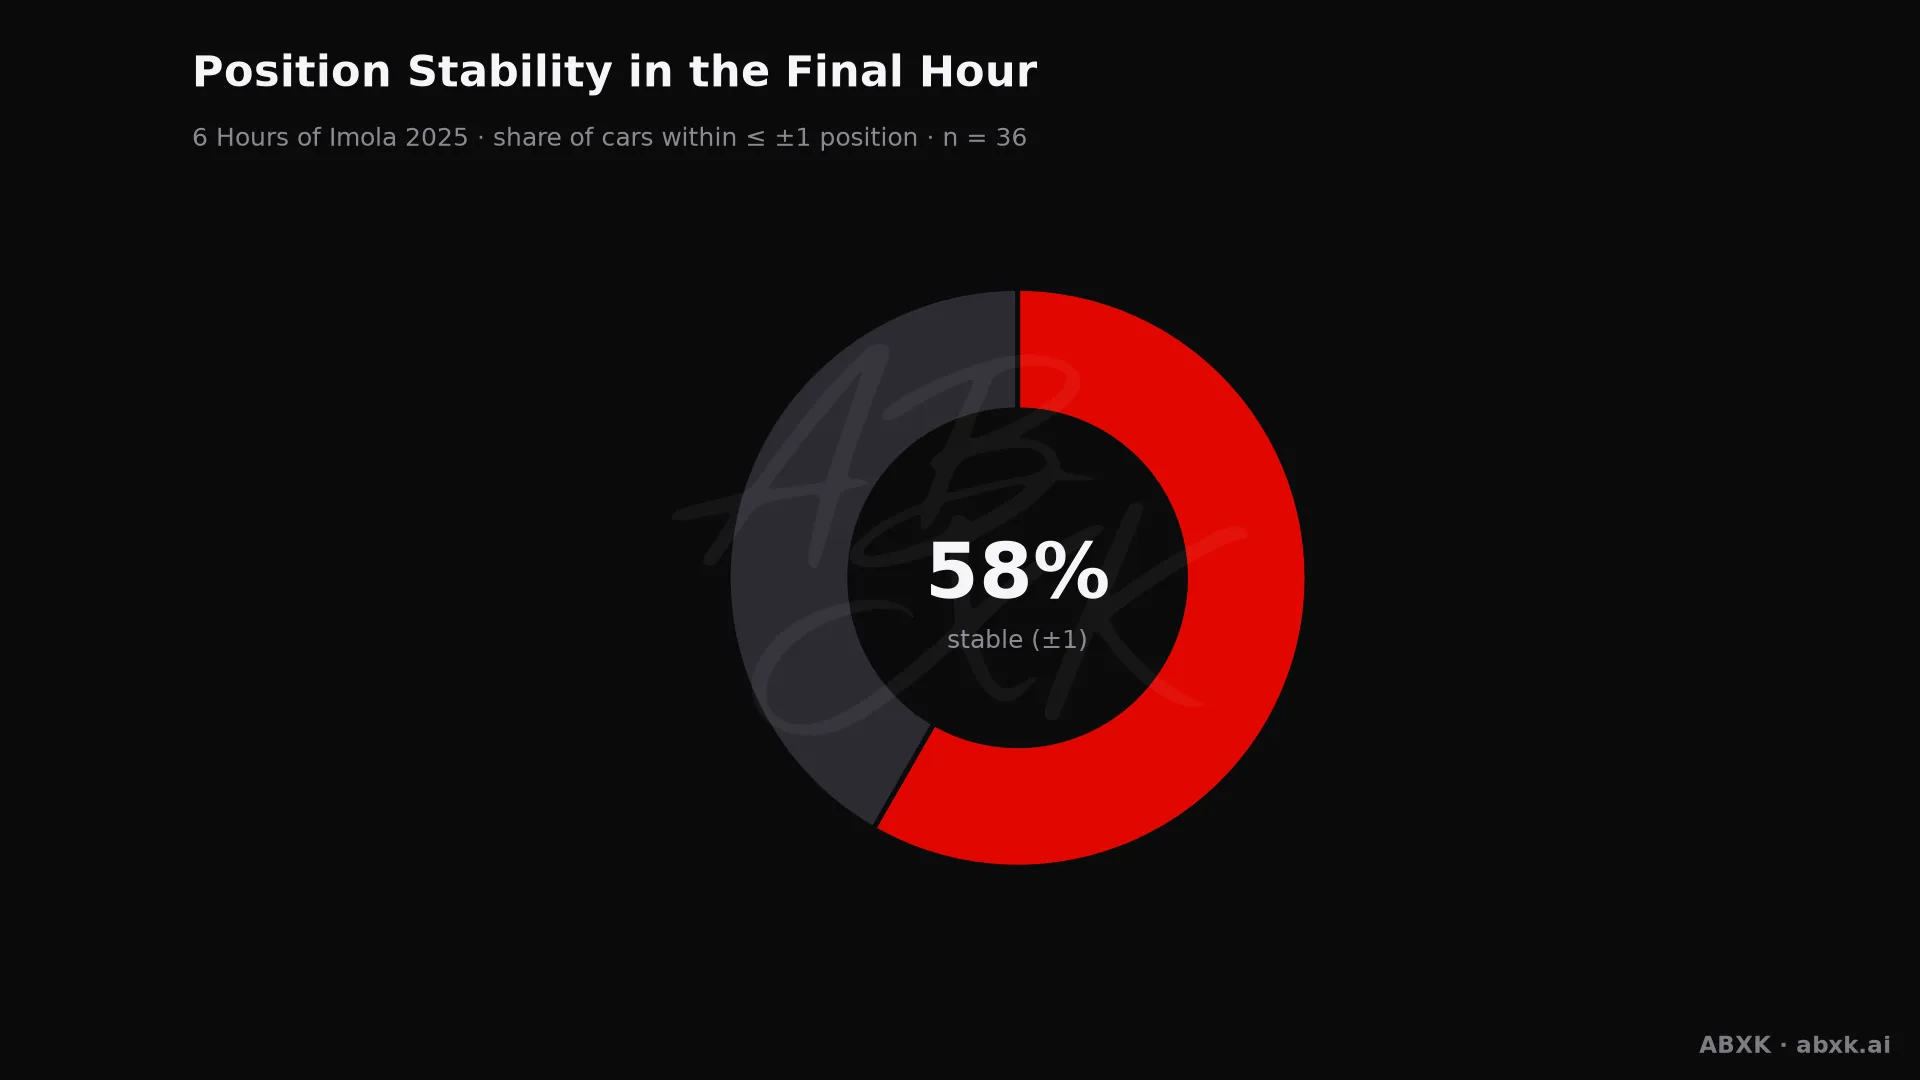
Share of cars that changed position by no more than one place in the final hour.
Figure 5 — Share of cars that changed position by no more than one place in the final hour.

Figure 5 shows how settled the finish really was.

Fastest Lap and Class Gaps

The fastest single lap of the race belongs to #50 Ferrari (Ferrari AF Corse): 1:32.504 at 191.0 km/h. Crew: Antonio Fuoco, Miguel Molina and Nicklas Nielsen.

Between HYPERCAR and LMGT3 sits a pace gap of 10.6 s per lap. That number decides how much traffic the leaders have to work through.

Class winners — HYPERCAR: #51 Ferrari (Ferrari AF Corse), LMGT3: #92 Porsche (Manthey).

Putting the Race in Context

The winner averaged 173.2 km/h across 1,041 km. On a 4.909 km lap, that is the pace the whole strategy had to sustain.

We calculate the same metrics for every race in the archive: pace order, reliability by class, lead changes, winning margin, closing stability and efficiency. That makes this race directly comparable with every other round of the 2025 season — and with the seasons before it.

All figures are derived from the full classification of every race hour and are recalculated with each build.

Overall result HYPERCAR

Full final classification of the top class after 6 hours — car, driver crew, laps, gap, fastest race lap and average pace.

Overall result
PosNoManufacturer / CarTeam & DriversLapsGapFastest lapØ FL km/h
1#51FerrariFerrariFerrari 499PFerrari AF CorseAlessandro Pier Guidi · James Calado · Antonio Giovinazzi2121:32.625190.8
2#20BMWBMWBMW M Hybrid V8BMW M Team WRTRené Rast · Robin Frijns · Sheldon van der Linde212+8.4901:32.916190.2
3#36AlpineAlpineAlpine A424Alpine Endurance TeamJules Gounon · Frédéric Makowiecki · Mick Schumacher212+12.4501:33.108189.8
4#83FerrariFerrariFerrari 499PFerrari AF CorseRobert Kubica · Yifei Ye · Philip Hanson212+20.5971:32.793190.4
5#8ToyotaToyotaToyota GR010 HybridToyota Gazoo RacingSébastien Buemi · Brendon Hartley · Ryo Hirakawa212+23.2101:32.926190.2
6#15BMWBMWBMW M Hybrid V8BMW M Team WRTDries Vanthoor · Raffaele Marciello · Kevin Magnussen212+25.5161:32.901190.2
7#7ToyotaToyotaToyota GR010 HybridToyota Gazoo RacingMike Conway · Kamui Kobayashi · Nyck de Vries212+31.4781:32.948190.1
8#6PorschePorschePorsche 963Porsche Penske MotorsportKévin Estre · Laurens Vanthoor · Matt Campbell212+41.2801:33.536188.9
9#93PeugeotPeugeotPeugeot 9X8Peugeot TotalEnergiesPaul di Resta · Mikkel Jensen · Jean-Eric Vergne212+50.9041:33.361189.3
10#12CadillacCadillacCadillac V-Series.RHertz Team JOTAAlex Lynn · Norman Nato · Will Stevens212+53.3001:33.438189.1
11#5PorschePorschePorsche 963Porsche Penske MotorsportJulien Andlauer · Michael Christensen · Mathieu Jaminet212+1'14.2201:33.499189
12#94PeugeotPeugeotPeugeot 9X8Peugeot TotalEnergiesLoïc Duval · Malthe Jakobsen · Stoffel Vandoorne212+1'15.2851:33.431189.1
13#35AlpineAlpineAlpine A424Alpine Endurance TeamPaul-Loup Chatin · Ferdinand Habsburg · Charles Milesi212+1'16.1351:33.336189.3
14#99PorschePorschePorsche 963Proton CompetitionNeel Jani · Nicolas Pino · Nicolas Varrone212+1'17.1501:33.465189.1
15#50FerrariFerrariFerrari 499PFerrari AF CorseAntonio Fuoco · Miguel Molina · Nicklas Nielsen211+1 Laps1:32.504191
16#38CadillacCadillacCadillac V-Series.RHertz Team JOTAEarl Bamber · Sébastien Bourdais · Jenson Button210+2 Laps1:33.698188.6
17#009Aston MartinAston MartinAston Martin ValkyrieAston Martin Thor TeamAlex Riberas · Marco Sorensen208+4 Laps1:34.350187.3
18#007Aston MartinAston MartinAston Martin ValkyrieAston Martin Thor TeamHarry Tincknell · Tom Gamble208+4 Laps1:34.552186.9

Season context: the full 2025 WEC season in data · all-time WEC records

Class winners in detail

The winners of each class with overall position, car, crew and fastest lap.

Class winners in detail
ClassOverallNoManufacturer / CarTeam & DriversLapsFastest lap
HYPERCARP1#51FerrariFerrariFerrari 499PFerrari AF CorseAlessandro Pier Guidi · James Calado · Antonio Giovinazzi2121:32.625
LMGT3P19#92PorschePorschePorsche 911 GT3 R LMGT3MantheyRyan Hardwick · Riccardo Pera · Richard Lietz1931:43.787

Manufacturer pace

Average of the fastest lap speed per manufacturer. It measures real pace over the distance, not a single outlier.

Ferrari
190.73
BMW
190.2
Toyota
190.15
Alpine
189.55
Peugeot
189.2
Porsche
189
Cadillac
188.85

Reliability by class

Retirement rate per class — the toughest filter of a long-distance race.

HYPERCAR
0% · n18
LMGT3
11.1% · n18

Lap efficiency score

(avg FL km/h × laps) normalized to the class mean. It combines pace, distance and durability in one number — 1.000 = class mean.

#51 Ferrari
1.010
#83 Ferrari
1.008
#20 BMW
1.007
#8 Toyota
1.007
#15 BMW
1.007
#7 Toyota
1.007
#50 Ferrari
1.007
#36 Alpine
1.005

Position stability, final hour

Share of cars that held their position within ±1 in the final hour (n=36).

58%

A lively closing phase with numerous late position changes.

Race dynamics compared

The same metrics for every race — so Le Mans is directly comparable with Daytona, and year with year.

3Lead changes (3 leaders)
8.490Winning margin over P2
10.6 sPace delta HYPERCAR → LMGT3
HYPERCARtop class analyzed
0.2 sClosest lead gap
6/6Hours inside 30 s
1,041 kmWinning distance
173.2Average speed km/h
490Position changes total
106Drivers in the field

Fastest race lap

The quickest single lap of the whole race — peak pace, not race pace.

1:32.504 · 191 km/h — #50 Ferrari, Ferrari AF Corse (HYPERCAR)
Antonio Fuoco · Miguel Molina · Nicklas Nielsen

Steadiest cars

Laps per hour and their spread. A low spread means few stops, few incidents, a clean rhythm.

NoManufacturerLaps/hSpread
#007Aston Martin34.4±1.62
#50Ferrari34.8±1.72
#20BMW35±1.9
#15BMW35±1.9
#8Toyota35±1.9
#7Toyota35±1.9

WEC record at this circuit

The World Endurance Championship has raced here 3 times in the seasons we analyze, and Toyota has won most often (2). Every entry links to the full data analysis of that race.

Fastest lap on record
1:31.794 · 192.5 km/h
#50 Ferrari, Ferrari AF Corse (2024)
Highest race average
174.2 km/h
Toyota (2026)
Seasons
2024, 2025, 2026
WEC races at this circuit
YearRaceWinnerDistanceCars
20266 Hours of Imola#8 Toyota
Toyota Gazoo Racing
1,046 km35
20256 Hours of Imola#51 Ferrari
Ferrari AF Corse
1,041 km36
20246 Hours of Imola#7 Toyota
Toyota Gazoo Racing
1,006 km37

All-time WEC records · every WEC season in data
