
Motorsport Data & AI · 6 Hours of Mexico City 2017 · Season 2017

6 Hours of Mexico City 2017 — AI Data Analysis

Porsche wins the 6 Hours of Mexico City 2017 with the #2 Porsche 919 Hybrid. Pace order, reliability by class, lead changes and the closing phase in a data check.

#2Winner · Porsche
240Laps led
26Cars total
6 hanalyzed

Winning crew · #2 Porsche LMP TeamTimo Bernhard · Earl Bamber · Brendon Hartley

Porsche won the 6 Hours of Mexico City 2017 at Autódromo Hermanos Rodríguez. The #2 Porsche 919 Hybrid of Porsche LMP Team covered 240 laps over 6 hours, a race distance of 1,033 km. The winning crew: Timo Bernhard, Earl Bamber and Brendon Hartley. The margin to second place was 7.1 s, close enough to keep the result open late. The fastest manufacturer also produced the winner.

How the Lead Was Won

Across the race we counted 0 lead changes among 1 different car in the LMP1 class. At the closest point, first and second were only 1.1 s apart. For 6 of 6 measured hours the gap stayed under 30 seconds.

That is a real head-to-head fight, not a comfortable lead.
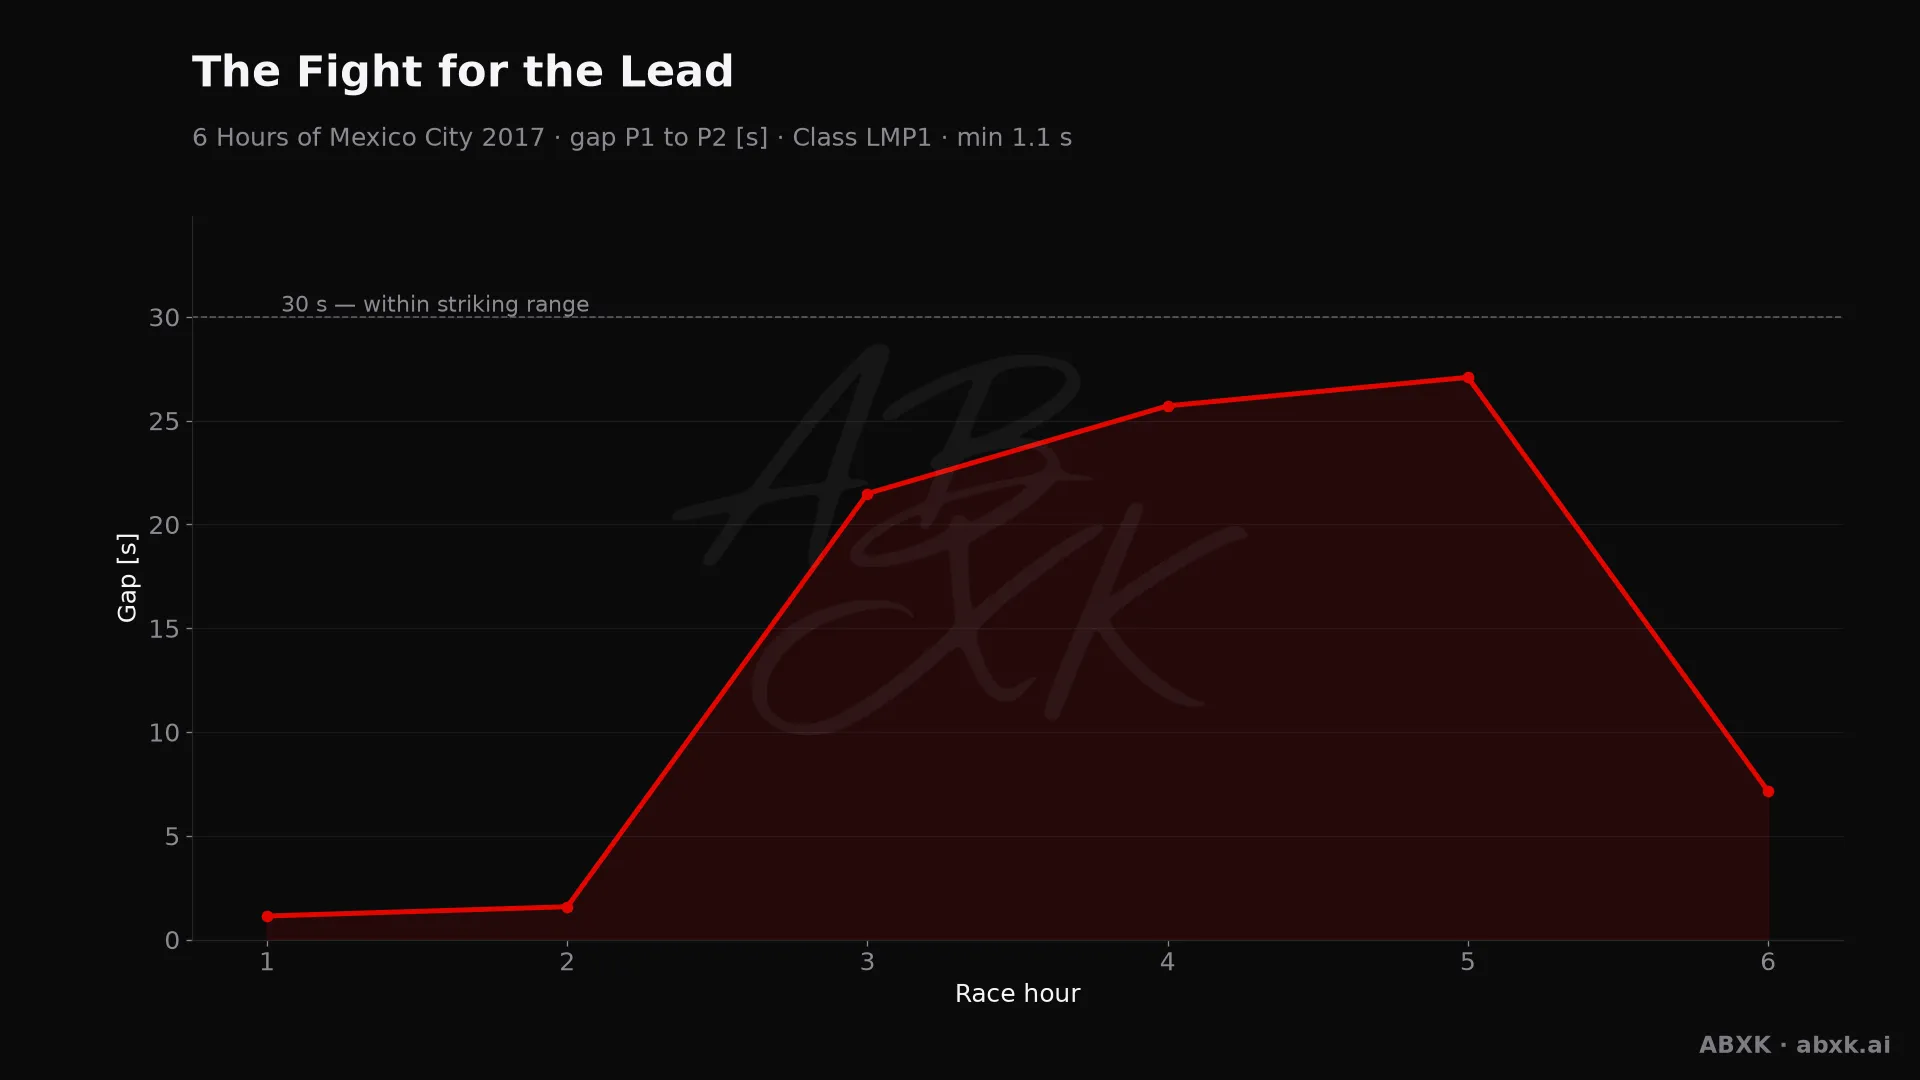
Gap between first and second in the LMP1 class, hour by hour. Peaks mark pit stops, safety cars and incidents.
Figure 1 — Gap between first and second in the LMP1 class, hour by hour. Peaks mark pit stops, safety cars and incidents.

Figure 1 shows how that gap moved over the distance.

Manufacturer Pace

We rank pace by the average of each manufacturer’s fastest lap. That measures real speed over the distance instead of one lucky lap. The order at the top: Porsche (180.6 km/h), Toyota (179.4 km/h).

Between the fastest and the slowest manufacturer in the LMP1 class lie 1.1 km/h. That is a tight field — the balance of performance is doing its job.
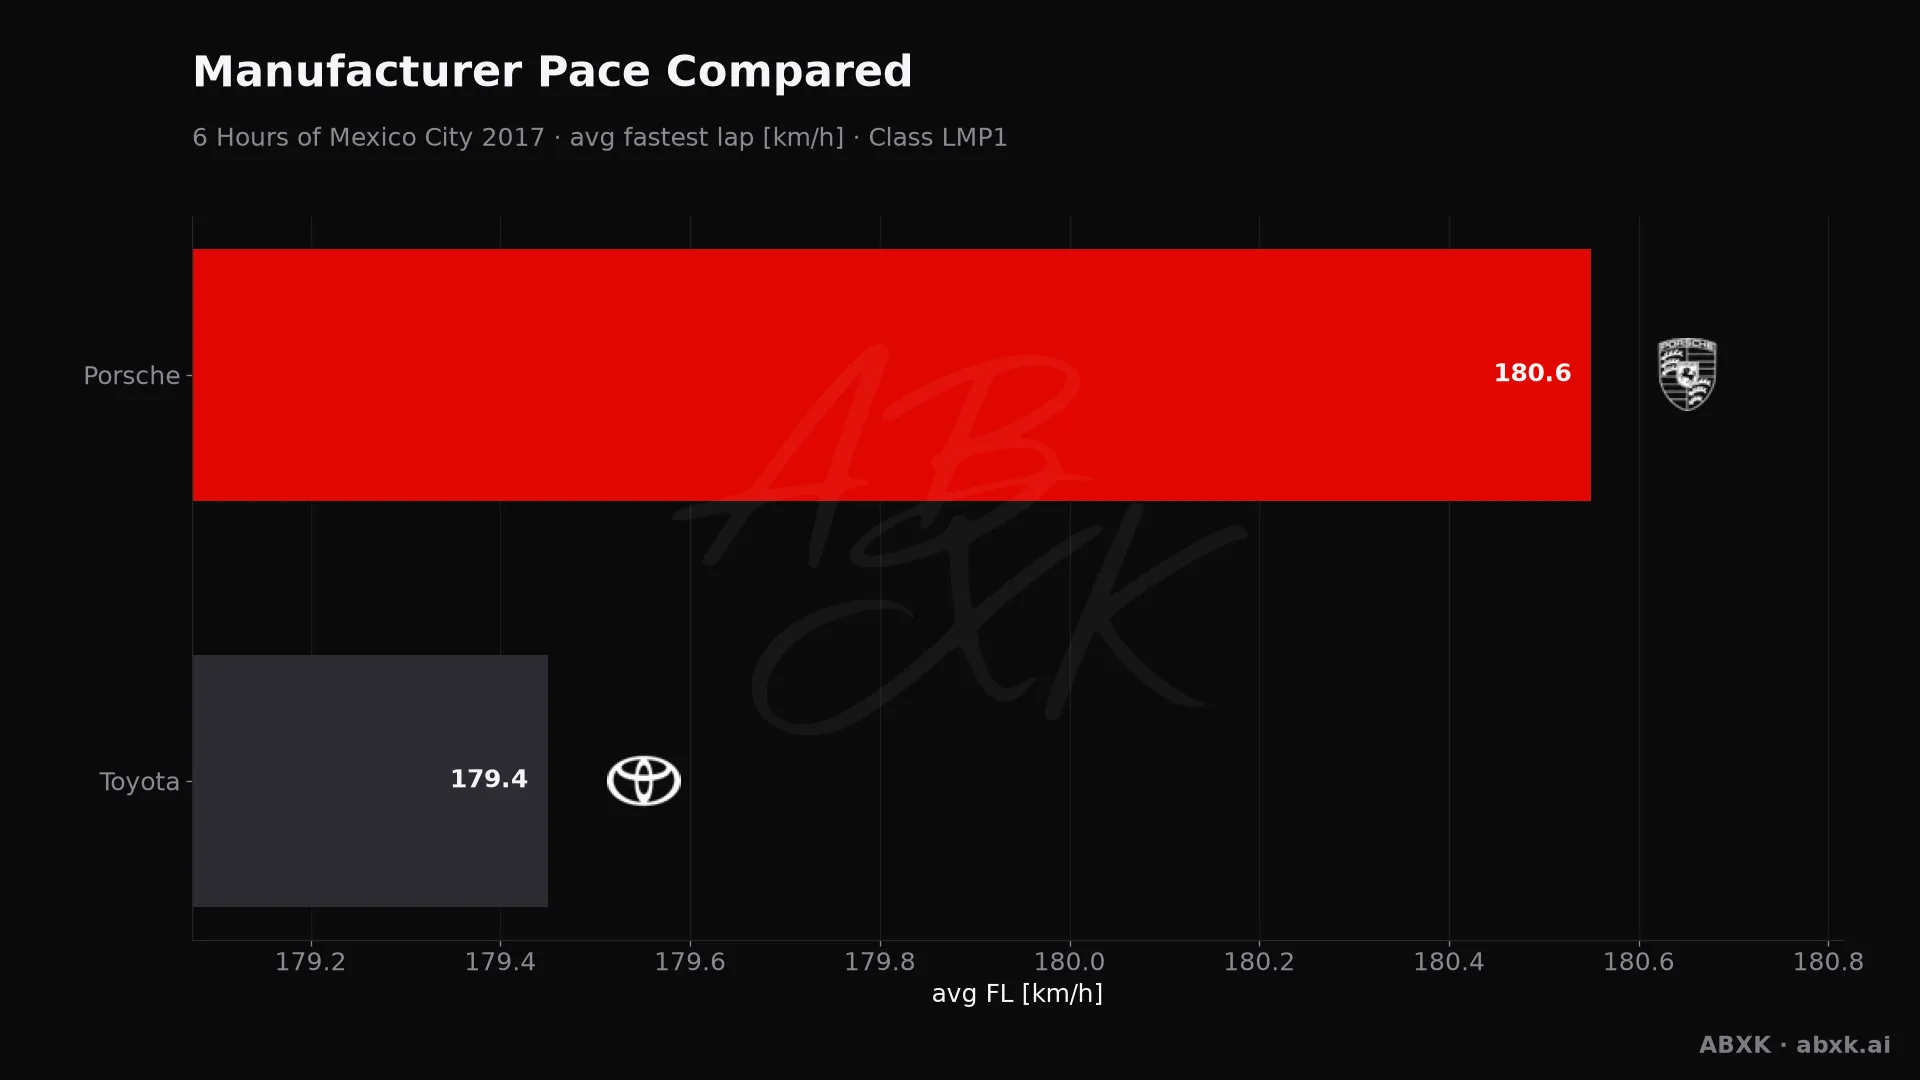
Average fastest lap speed per manufacturer in the LMP1 class. Higher is faster.
Figure 2 — Average fastest lap speed per manufacturer in the LMP1 class. Higher is faster.

Figure 2 sets the pace order side by side.

Reliability by Class

1 of 26 cars did not make the finish — an overall retirement rate of 4%. The heaviest toll fell on LMGTE Pro with 12%, while LMGTE Am came through best at 0%.

Over this distance, reliability is a result in itself. A car that stops scores nothing, no matter how fast it was.
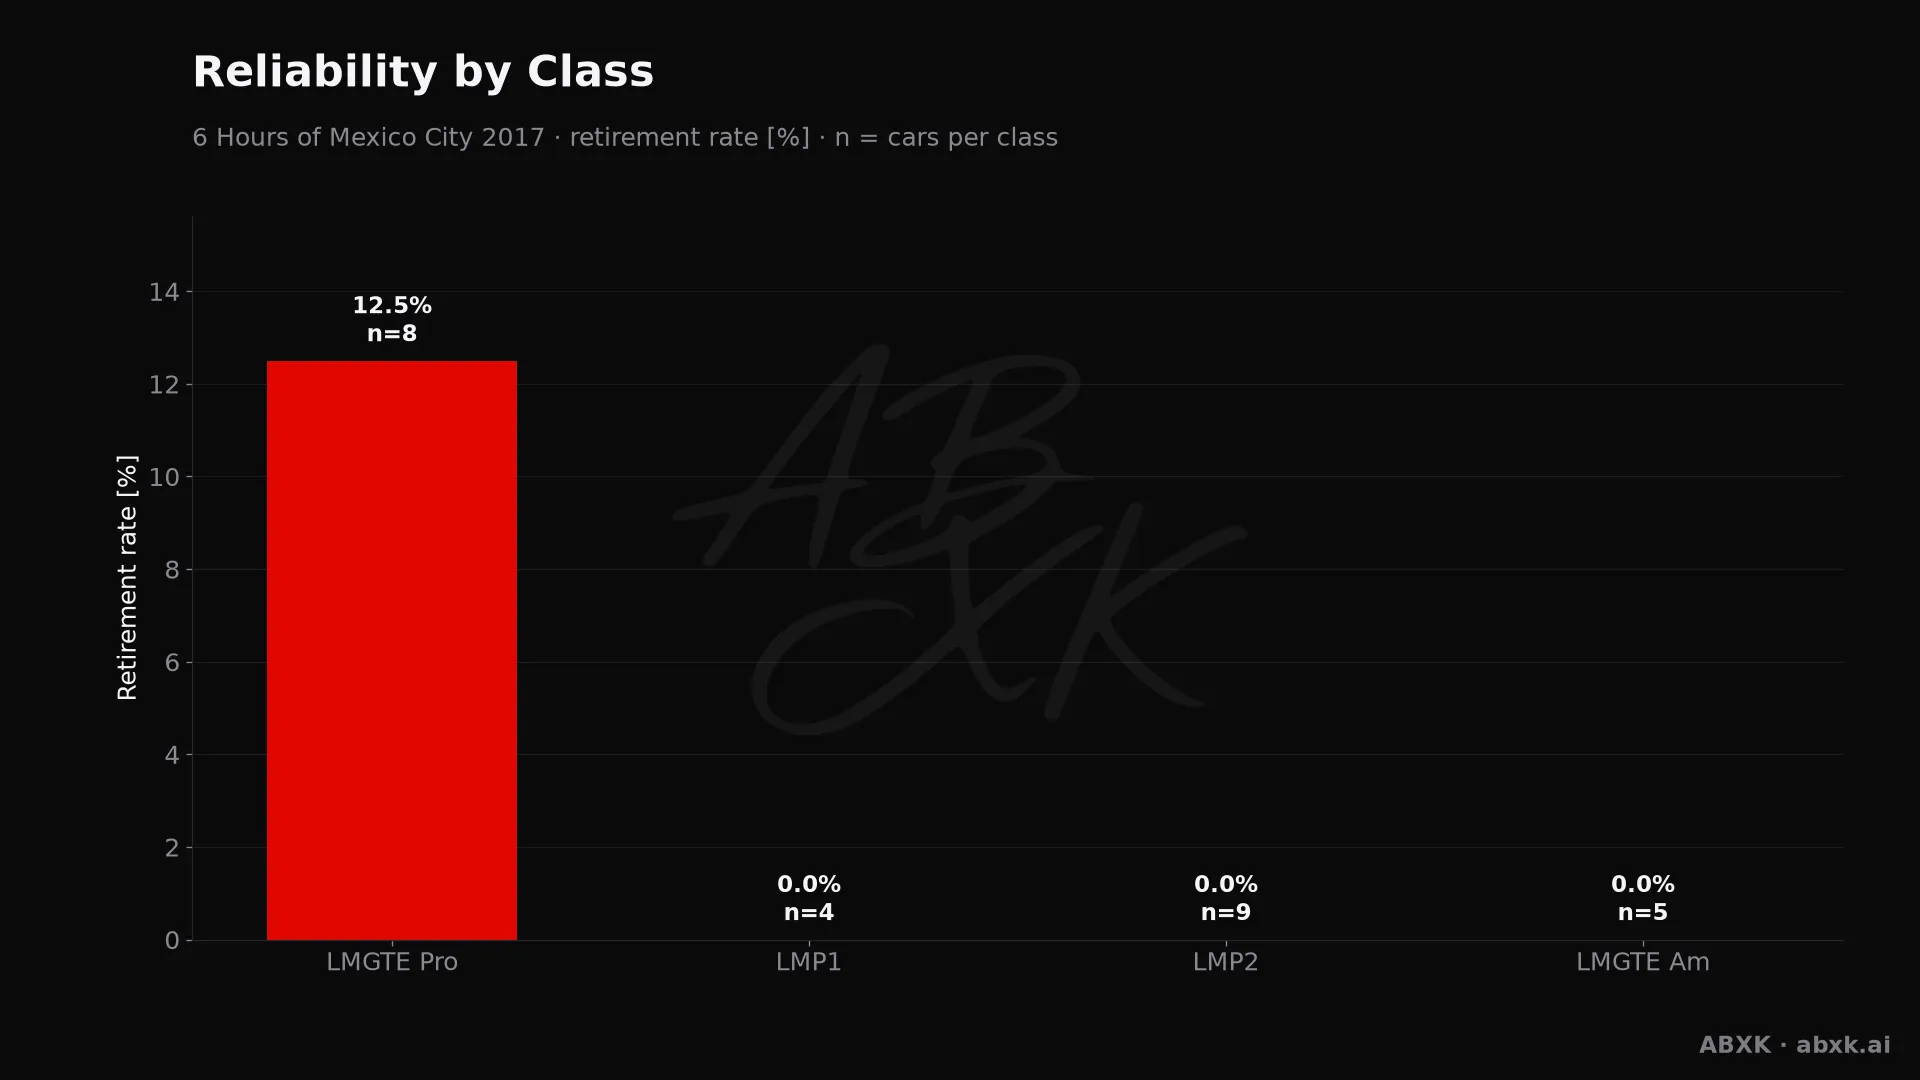
Retirement rate per class, with the number of entries behind each bar.
Figure 3 — Retirement rate per class, with the number of entries behind each bar.

Figure 3 compares the classes directly.

Efficiency Over the Distance

Our efficiency score multiplies average lap speed by laps completed and compares that to the class average. It rewards cars that were fast and stayed out of trouble. A value of 1.000 is exactly class average.

The top score goes to #2 Porsche with 1.006. That is the winning car — speed and durability came from the same package.
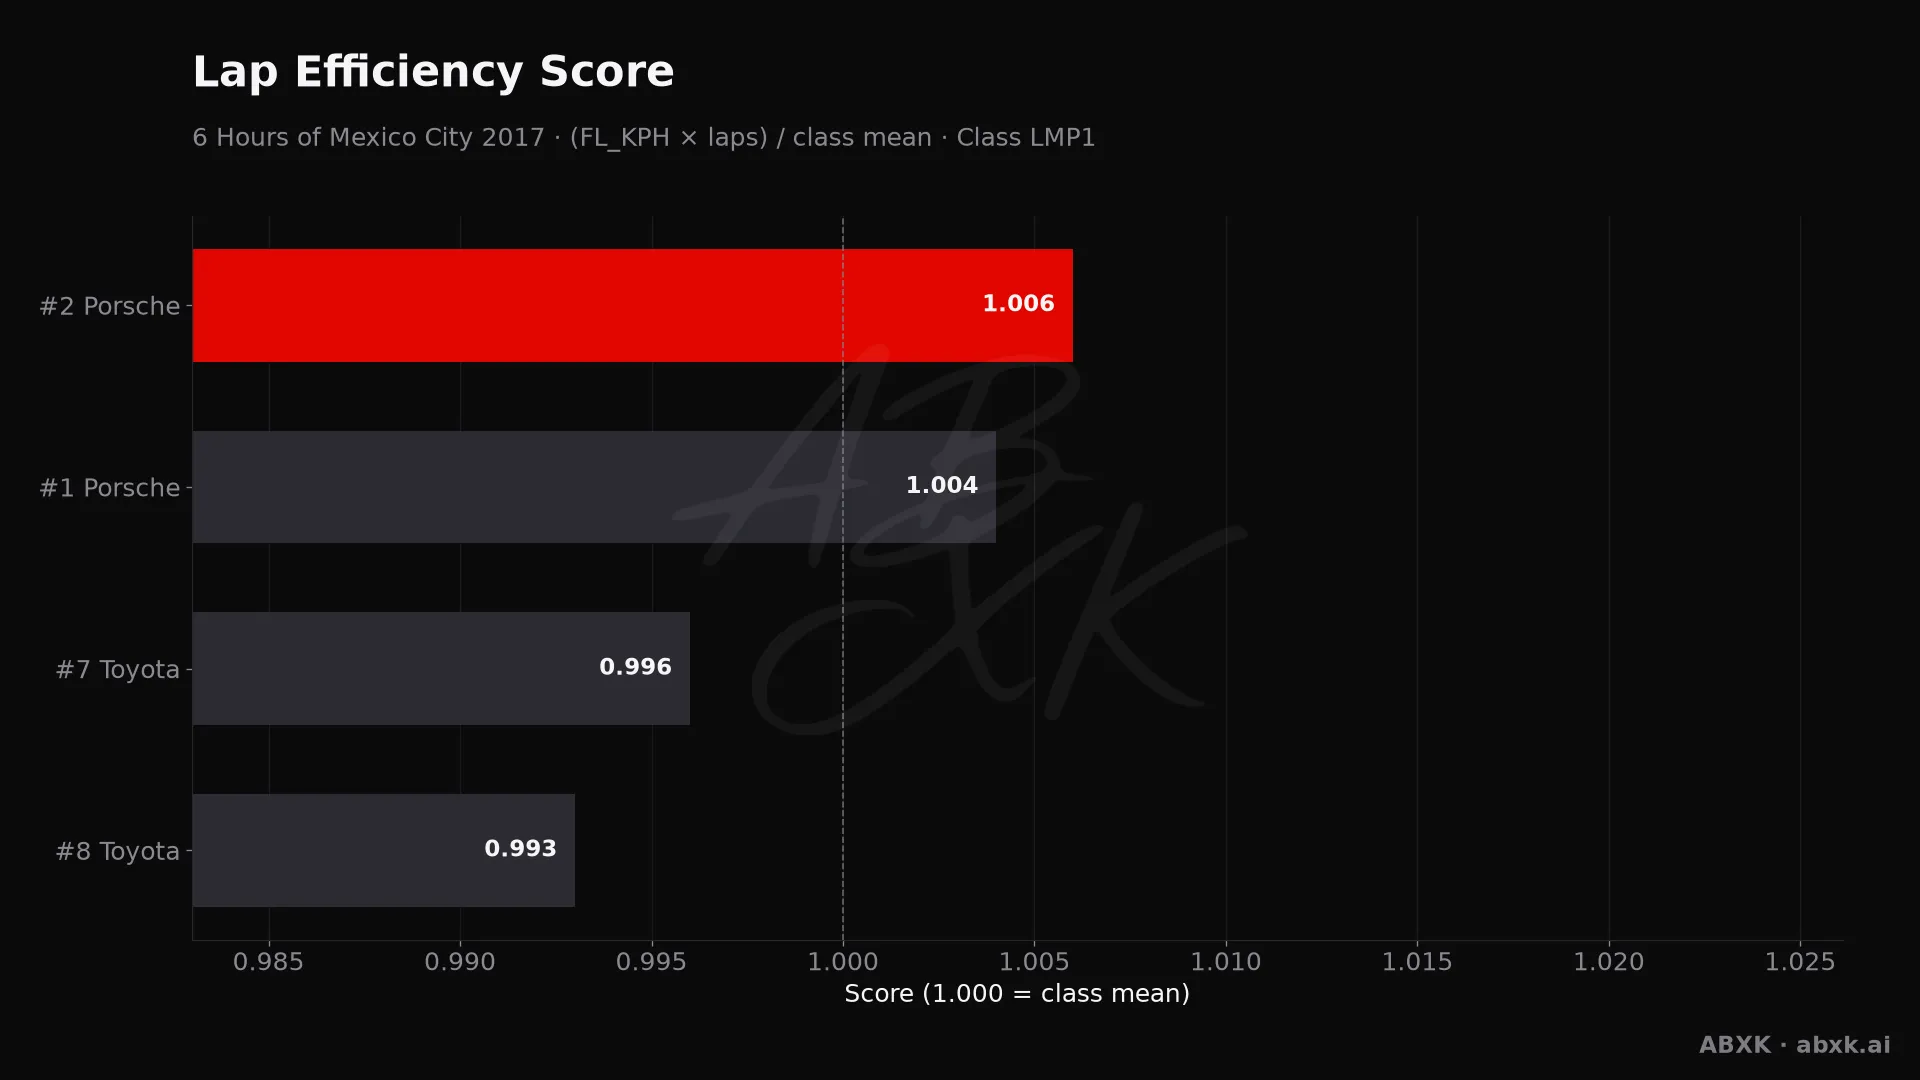
Efficiency score per car: average lap speed times laps, normalized to the class average.
Figure 4 — Efficiency score per car: average lap speed times laps, normalized to the class average.

Figure 4 ranks the cars by that score.

The Closing Phase

In the final hour, 92% of the field held position within ±1 place (n = 26). The race was settled well before the flag. The biggest single move came from #24 Oreca, 2 places back.
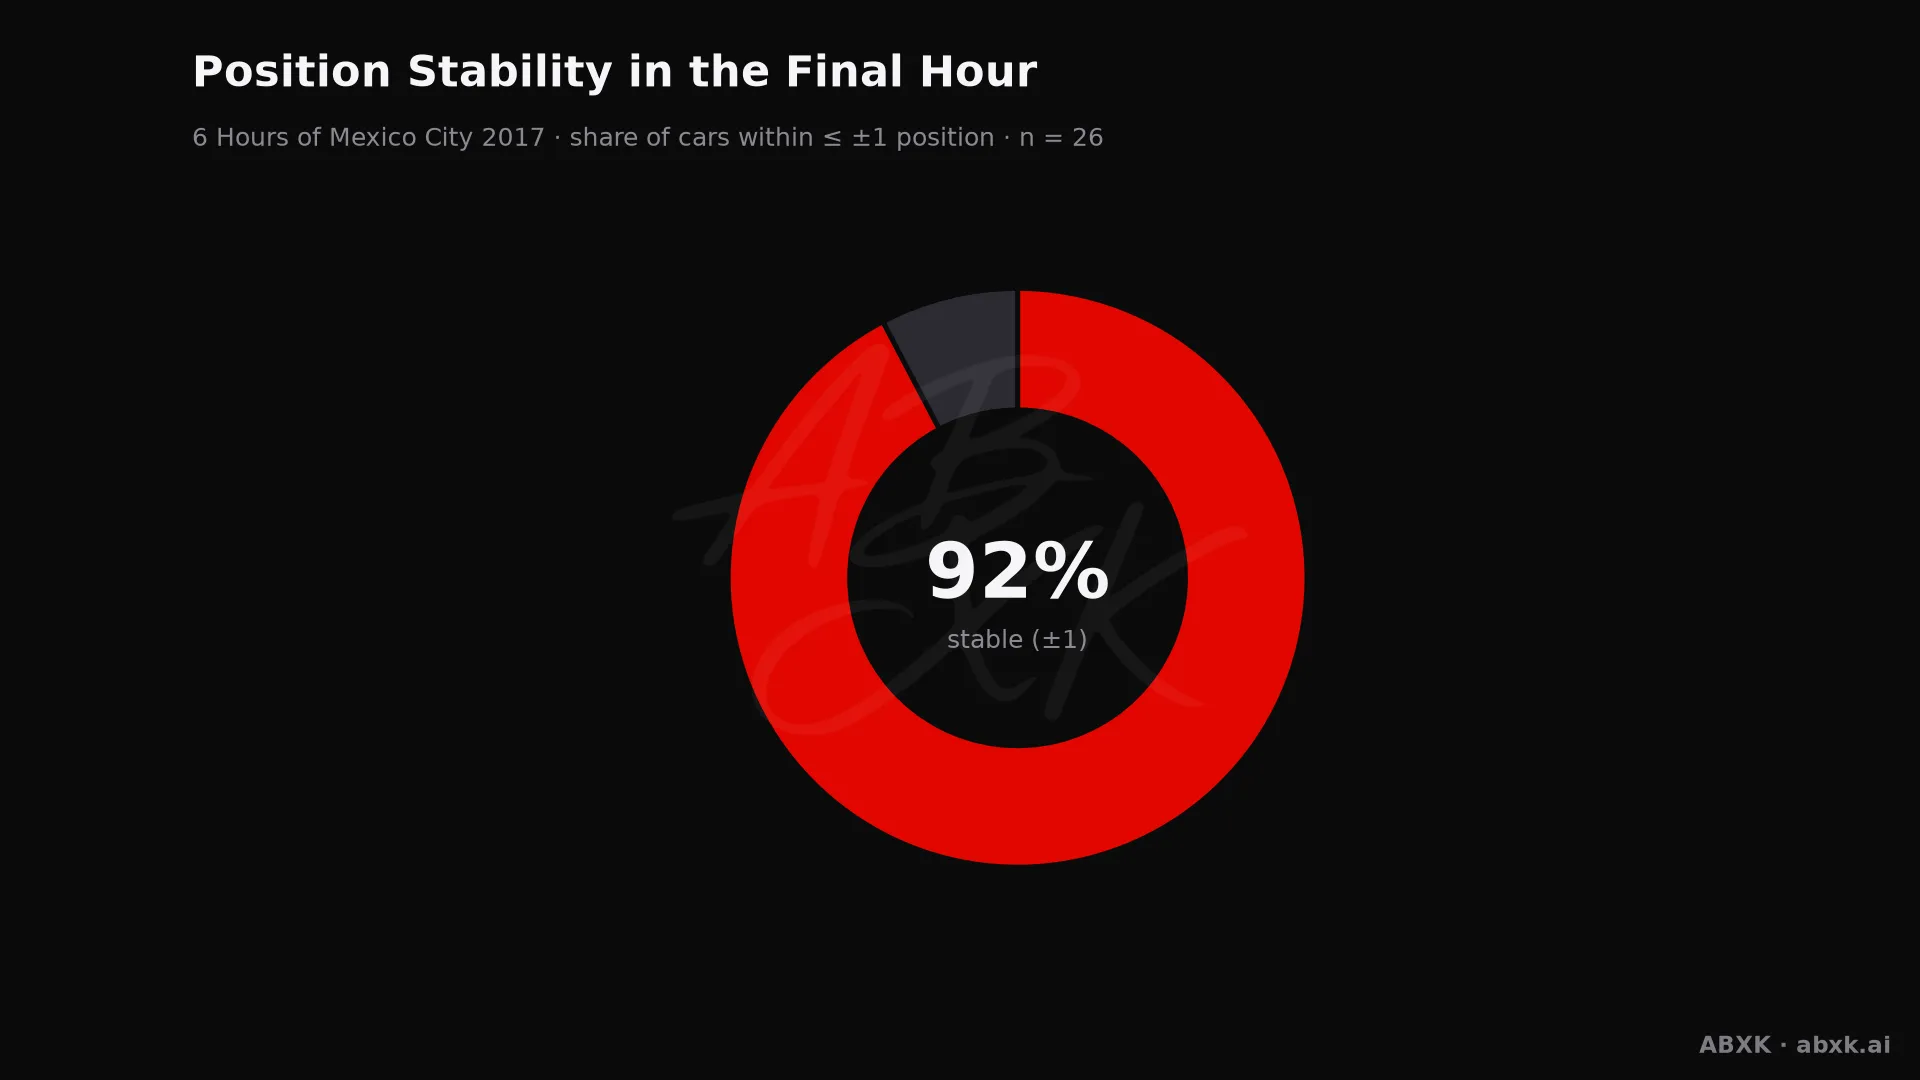
Share of cars that changed position by no more than one place in the final hour.
Figure 5 — Share of cars that changed position by no more than one place in the final hour.

Figure 5 shows how settled the finish really was.

Fastest Lap and Class Gaps

The fastest single lap of the race belongs to #2 Porsche (Porsche LMP Team): 1:25.730 at 180.7 km/h. Crew: Timo Bernhard, Earl Bamber and Brendon Hartley.

Between LMP1 and LMP2 sits a pace gap of 8.2 s per lap. That number decides how much traffic the leaders have to work through.

Class winners — LMP1: #2 Porsche (Porsche LMP Team), LMP2: #31 Oreca (Vaillante Rebellion), LMGTE Pro: #95 Aston Martin (Aston Martin Racing), LMGTE Am: #77 Porsche (Dempsey - Proton Racing).

Putting the Race in Context

The winner averaged 172.1 km/h across 1,033 km. On a 4.304 km lap, that is the pace the whole strategy had to sustain.

We calculate the same metrics for every race in the archive: pace order, reliability by class, lead changes, winning margin, closing stability and efficiency. That makes this race directly comparable with every other round of the 2017 season — and with the seasons before it.

All figures are derived from the full classification of every race hour and are recalculated with each build.

Overall result LMP1

Full final classification of the top class after 6 hours — car, driver crew, laps, gap, fastest race lap and average pace.

Overall result
PosNoManufacturer / CarTeam & DriversLapsGapFastest lapØ FL km/h
1#2PorschePorschePorsche 919 HybridPorsche LMP TeamTimo Bernhard · Earl Bamber · Brendon Hartley2401:25.730180.7
2#1PorschePorschePorsche 919 HybridPorsche LMP TeamNeel Jani · André Lotterer · Nick Tandy240+7.1411:25.876180.4
3#8ToyotaToyotaToyota TS050 HybridToyota Gazoo RacingSébastien Buemi · Anthony Davidson · Kazuki Nakajima239+1 Laps1:26.445179.2
4#7ToyotaToyotaToyota TS050 HybridToyota Gazoo RacingMike Conway · Kamui Kobayashi · Jose Maria Lopez239+1 Laps1:26.240179.7

Season context: the full 2017 WEC season in data · all-time WEC records

Class winners in detail

The winners of each class with overall position, car, crew and fastest lap.

Class winners in detail
ClassOverallNoManufacturer / CarTeam & DriversLapsFastest lap
LMP1P1#2PorschePorschePorsche 919 HybridPorsche LMP TeamTimo Bernhard · Earl Bamber · Brendon Hartley2401:25.730
LMP2P5#31OrecaOreca 07Vaillante RebellionJulien Canal · Nicolas Prost · Bruno Senna2191:33.670
LMGTE ProP14#95Aston MartinAston MartinAston Martin Vantage GTEAston Martin RacingNicki Thiim · Marco Sørensen2091:40.268
LMGTE AmP21#77PorschePorschePorsche 911 RSR (991)Dempsey - Proton RacingChristian Ried · Matteo Cairoli · Marvin Dienst2041:41.976

Manufacturer pace

Average of the fastest lap speed per manufacturer. It measures real pace over the distance, not a single outlier.

Porsche
180.55
Toyota
179.45

Reliability by class

Retirement rate per class — the toughest filter of a long-distance race.

LMGTE Am
0% · n5
LMGTE Pro
12.5% · n8
LMP1
0% · n4
LMP2
0% · n9

Lap efficiency score

(avg FL km/h × laps) normalized to the class mean. It combines pace, distance and durability in one number — 1.000 = class mean.

#2 Porsche
1.006
#1 Porsche
1.004
#7 Toyota
0.996
#8 Toyota
0.993

Position stability, final hour

Share of cars that held their position within ±1 in the final hour (n=26).

92%

The race was decided early — the closing phase brought barely any movement.

Race dynamics compared

The same metrics for every race — so Le Mans is directly comparable with Daytona, and year with year.

0Lead changes (1 leaders)
7.141Winning margin over P2
8.2 sPace delta LMP1 → LMP2
LMP1top class analyzed
1.1 sClosest lead gap
6/6Hours inside 30 s
1,033 kmWinning distance
172.1Average speed km/h
108Position changes total
71Drivers in the field

Fastest race lap

The quickest single lap of the whole race — peak pace, not race pace.

1:25.730 · 180.7 km/h — #2 Porsche, Porsche LMP Team (LMP1)
Timo Bernhard · Earl Bamber · Brendon Hartley

Steadiest cars

Laps per hour and their spread. A low spread means few stops, few incidents, a clean rhythm.

NoManufacturerLaps/hSpread
#7Toyota39.6±0.8
#2Porsche39.8±0.98
#1Porsche39.8±0.98
#8Toyota39.6±1.02

WEC record at this circuit

The World Endurance Championship has raced here 2 times in the seasons we analyze, and Porsche has won most often (2). Every entry links to the full data analysis of that race.

Fastest lap on record
1:25.730 · 180.7 km/h
#2 Porsche, Porsche LMP Team (2017)
Highest race average
172.1 km/h
Porsche (2017)
Seasons
2016, 2017
WEC races at this circuit
YearRaceWinnerDistanceCars
20176 Hours of Mexico City#2 Porsche
Porsche LMP Team
1,033 km26
20166 Hours of Mexico City#1 Porsche
Porsche Team
990 km32

All-time WEC records · every WEC season in data