

Every crash of a car that drives itself on US roads has to be reported to the National Highway Traffic Safety Administration (NHTSA), the federal road safety authority, and the reports are public. We analyzed all 1,551 reports on vehicles with an automated driving system that NHTSA has published for crashes since June 2025, when the current version of the reporting rule took effect. The picture is more specific than most headlines: the typical crash is slow, the robot car is often standing still, and most crashes end without injuries.
What has to be reported
The rule is NHTSA’s Standing General Order 2021-01, in its third version since June 16, 2025. It covers vehicles with an automated driving system (ADS), SAE Levels 3 to 5: in practice robotaxis, driverless shuttles and delivery vehicles, and test vehicles with a safety driver. A crash has to be reported if the system was active at any time within 30 seconds before the crash and the crash caused a death, a hospital visit, an air bag deployment, a tow, a collision with a pedestrian or cyclist, or property damage above a set limit. Serious crashes have to be reported within five days, all others by the 15th of the following month.
Driver assistance (SAE Level 2), where a human drives and stays responsible, has its own reports. Those are not part of this analysis.
| The reports contain | The reports do not contain |
|---|---|
| Date, state, road type and weather | Miles driven, so there are no crash rates |
| What the vehicle hit, and how fast it was going | A finding on who caused the crash |
| Injuries, as alleged in the report | Crashes before June 2025, under older rules |
| Whether a safety driver was on board | Driver assistance crashes (SAE Level 2) |
Most crashes happen at low speed or standing still
In 50.9% of the reports with a speed, the automated vehicle was not moving at all, and in 77.4% it was going 10 mph or slower. Measured by the movement just before the crash, the vehicle was stopped or parked in 50.2% of all reports, and 22.1% of the reports list damage at the rear of the vehicle.
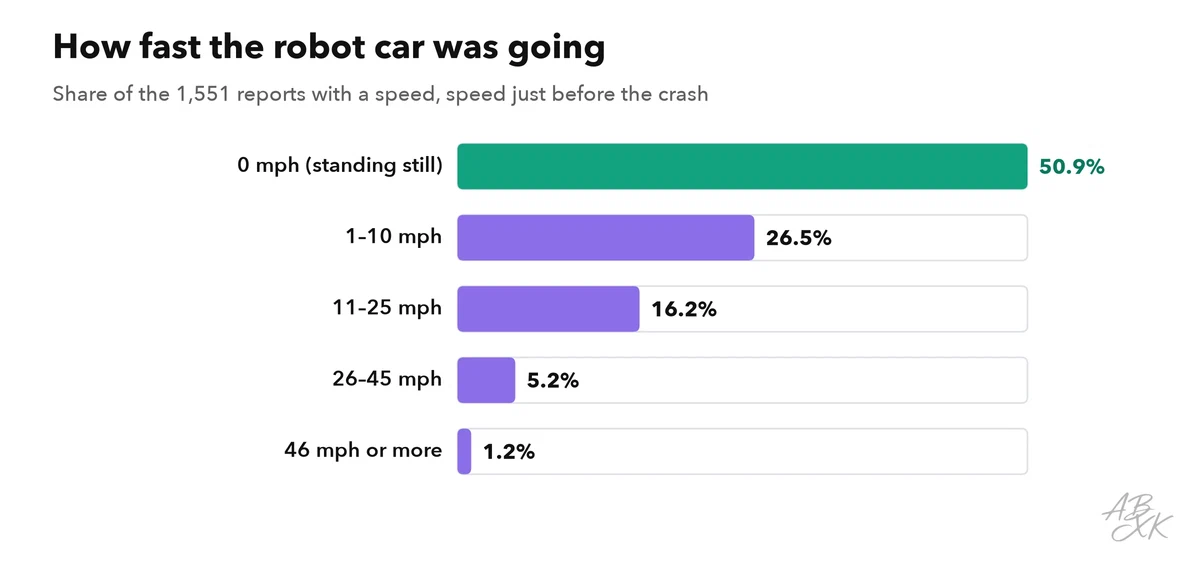
The reports do not say who caused a crash. But the pattern explains why so many crashes look alike: a robot car that stops in traffic, at a light or for a pedestrian is easy to hit from behind or from the side. In 83.3% of the reports, nobody was in the driver’s seat, which means the crashes come mostly from commercial driverless fleets, not from test drives.
| Movement | Reports | Share |
|---|---|---|
| Stopped (traffic, light) | 660 | 42.6% |
| Driving straight | 543 | 35.0% |
| Parked | 118 | 7.6% |
| Turning left | 68 | 4.4% |
| Turning right | 42 | 2.7% |
| Changing lanes | 37 | 2.4% |
| Backing up | 26 | 1.7% |
| Passing | 21 | 1.4% |
Data: NHTSA, Standing General Order 2021-01, crash reports for vehicles with an automated driving system (ADS), crashes from June 2025 to August 2026, latest version of each report; retrieved on October 18, 2026, our analysis.
What the cars hit
Most crash partners are other cars. Collisions with trucks and buses follow, then fixed objects such as poles, barriers or parked equipment. 37 reports involve a cyclist, a pedestrian or a motorcycle, the road users who are most at risk in any crash.
| Crash partner | Reports | Share |
|---|---|---|
| Car, SUV, pickup or van | 1,076 | 69.4% |
| Truck or bus | 202 | 13.0% |
| Cyclist, pedestrian or motorcycle | 37 | 2.4% |
| Object, pole, tree or animal | 107 | 6.9% |
| Other or unclear | 129 | 8.3% |
Source as for the first table on this page.
How severe the crashes were
88.3% of the reports list no injuries, only property damage. 6 reports list a serious injury or a death, 2 of them a death. The severity is what the reporting company was told or alleges; NHTSA does not verify each report before it publishes the data.
| Injury | Reports | Share |
|---|---|---|
| No injury reported | 1,369 | 88.3% |
| Minor | 138 | 8.9% |
| Moderate | 13 | 0.8% |
| Serious | 4 | 0.3% |
| Fatal | 2 | 0.1% |
| Unknown | 25 | 1.6% |
Source as for the first table on this page.
Where the crashes happen
The reports come from 14 states, and California alone accounts for 52.1% of them. That reflects where driverless fleets operate, mainly in San Francisco and Los Angeles, Phoenix and Austin, not where driving is most dangerous.
| State | Reports | Share |
|---|---|---|
| California | 808 | 52.1% |
| Texas | 322 | 20.8% |
| Arizona | 208 | 13.4% |
| Georgia | 81 | 5.2% |
| Nevada | 49 | 3.2% |
| Florida | 47 | 3.0% |
| Tennessee | 10 | 0.6% |
| Pennsylvania | 7 | 0.5% |
Source as for the first table on this page.
Why more reports do not mean less safety
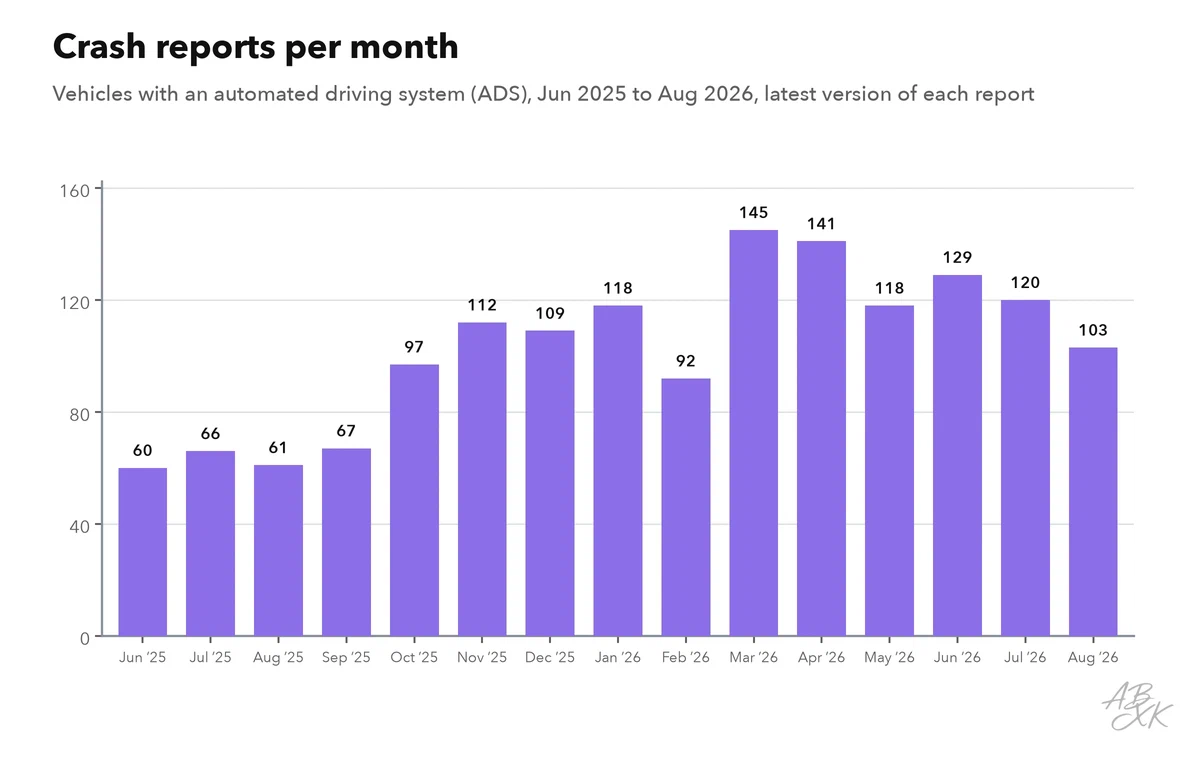
The number of reports grew from an average of 62 a month in the first three months to 126 a month in the last six. That sounds alarming, but the fleets grew at the same time, and every mile driven creates a chance to be hit. The public files contain no miles driven, so a report count cannot be turned into a crash rate. A fair comparison needs crashes per million miles, compared with human drivers on the same roads at the same times of day, and many minor crashes of human drivers never reach any statistic because no police report is filed. Some companies publish such figures for their own fleets; the NHTSA data cannot provide them.
This is also why this page shows no ranking of companies: one company with a large fleet and many miles will always file more reports than a small test program.
How we counted
We used the public file of NHTSA reports for ADS vehicles (Standing General Order 2021-01) and kept the latest version of each report, because follow-up reports replace the first one. The series per month starts in June 2025, the first full month under the current rule, and ends with the last full month; the newest month is still incomplete because monthly reports arrive by the 15th of the following month. Speeds come from the report’s field for the vehicle’s speed before the crash; reports without a speed are left out of the speed table. The source and date are below each table.
How these vehicles see the road, plan and brake is the subject of our learning path in Physical AI.