

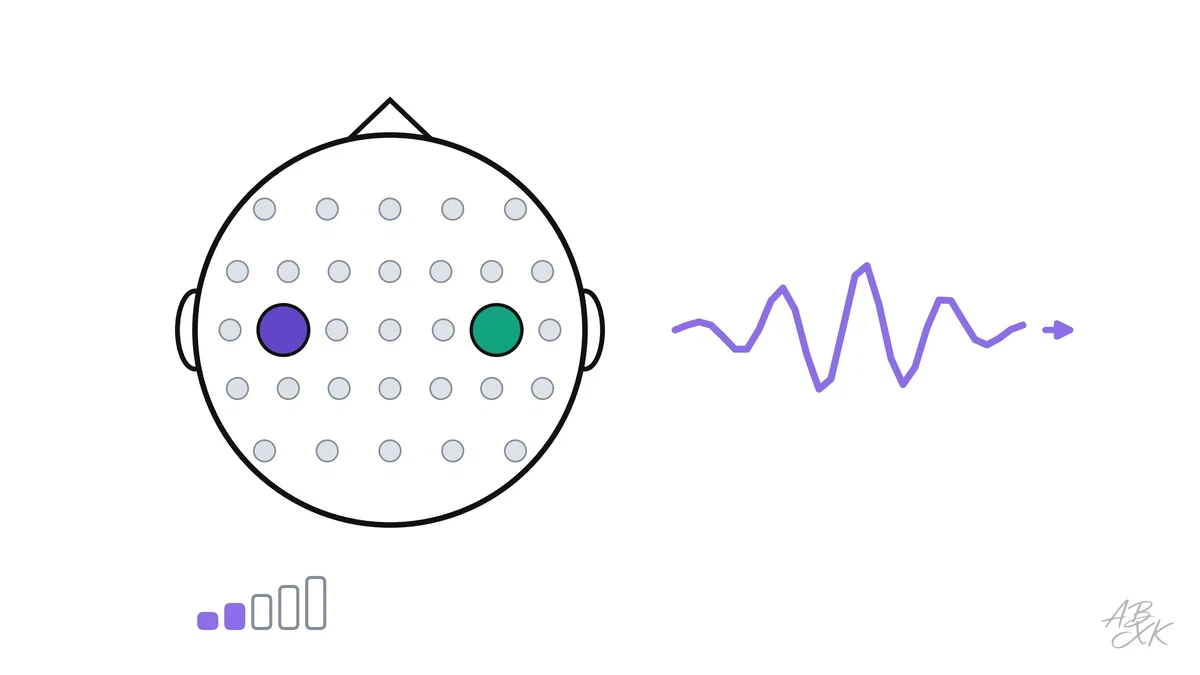
Brain-computer interfaces come in two very different forms. Some use electrodes implanted in the brain, which requires surgery but picks up detailed signals. Most use an EEG, electrodes in a cap on the scalp: no surgery, cheap and safe, but much less precise. Of the 280 brain-computer interface studies in the US clinical trial registry, we classified 129 as non-invasive and 59 as implanted. So what can a computer actually read from an EEG?
This is part 4 of Level 1 in our learning path Physical AI. We tested a classic task on public EEG recordings of 106 volunteers: can a program tell whether a person imagines closing the left or the right fist? You will learn what an EEG measures, which brain pattern makes this possible and why it works well for some people and hardly at all for most.
What an EEG measures
Every thought and every movement comes with tiny electrical currents in the brain. When millions of neurons in the same area are active at the same rhythm, their currents add up to a tiny voltage on the scalp, counted in millionths of a volt. Skull and skin blur this signal, so an EEG cannot see single neurons. It sees the sum of large groups, a bit like hearing a stadium crowd from outside without understanding a single conversation.
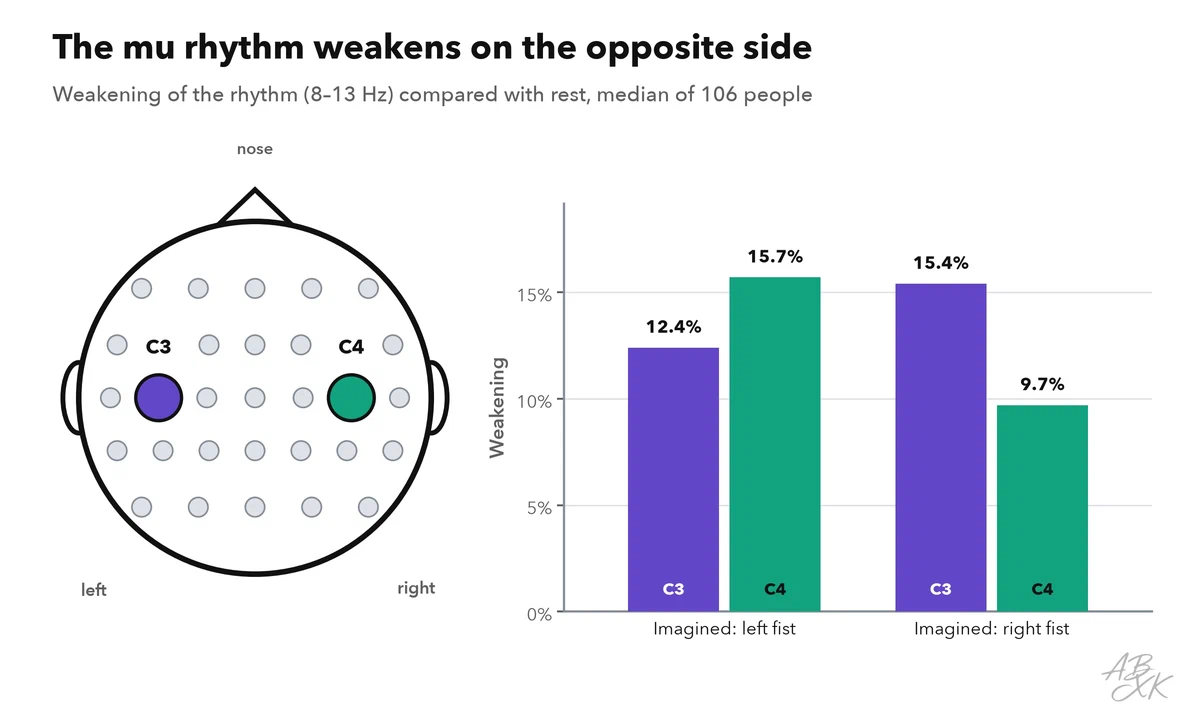
What an EEG does show well are rhythms. Over the motor cortex, the strip of the brain that controls movement, there is a rhythm of about 8 to 13 waves per second, the mu rhythm. It is strong when the body is at rest. When you move a hand, or only imagine moving it, the mu rhythm becomes weaker, and it does so mainly on the opposite side of the brain: the left hemisphere controls the right hand, and the right hemisphere controls the left hand. Researchers call this weakening event-related desynchronization.
The pattern in our data
The recordings come from 64 electrodes. Two of them sit directly over the hand areas of the motor cortex: C3 on the left and C4 on the right. We measured the strength of the mu rhythm at both while the volunteers imagined a movement, and compared it with rest.
When people imagined closing the right fist, the mu rhythm weakened by 15.4% over the left hemisphere (C3) but only by 9.7% over the right hemisphere (C4). For the left fist, it was the other way round: 15.7% at C4 and 12.4% at C3.
| Imagined | Over C3 (left hemisphere) | Over C4 (right hemisphere) |
|---|---|---|
| Left fist | -12.4% | -15.7% |
| Right fist | -15.4% | -9.7% |
Our own experiment with the EEG Motor Movement/Imagery Dataset (G. Schalk et al., BCI2000; PhysioNet, license ODC-By 1.0), retrieved on October 18, 2026: 106 participants, runs 4, 8, 12 (imagining the left or right fist), 64 channels. Band-pass 8–30 Hz, window 0.5–2.5 s after the cue, common spatial patterns and linear discriminant analysis, five-fold cross-validation per participant; fixed seed.
The pattern is there, just as the textbooks describe it. But look at the size: the difference between the two sides is only a few percentage points, and these are medians across all volunteers. In a single four-second attempt of a single person, the pattern is buried in noise from blinking, muscle tension and electrical interference.
Can a program read it?
To find out, we trained a separate decoder for each volunteer with a classic method of BCI research. Common spatial patterns combine the 64 electrodes into a few signals in which the difference between left and right is as large as possible; a simple linear classifier then decides. Each volunteer had performed 45 attempts in the median, and we tested with five-fold cross-validation: the decoder never saw the attempts it was tested on.
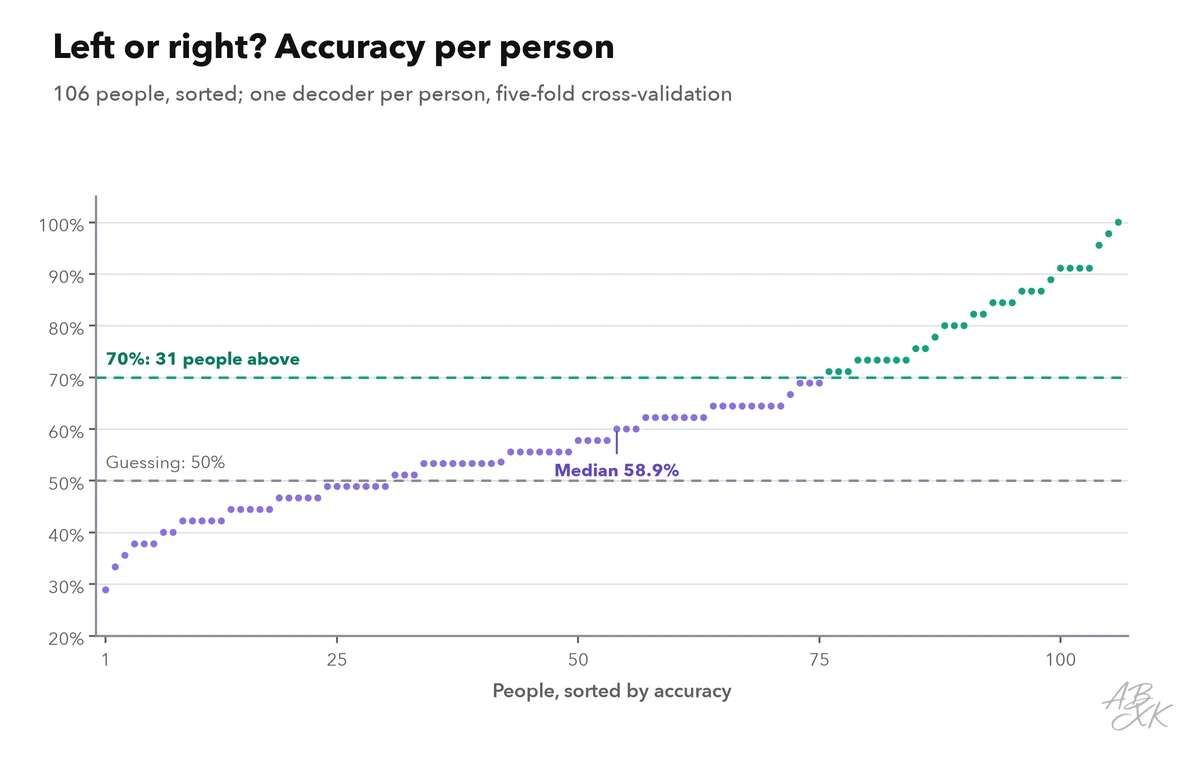
Guessing would give 50%. The median volunteer reached 58.9%. For 31 of 106 volunteers (29.2%), the decoder reached 70% or more, a level often cited in BCI research as the minimum for useful communication. The best volunteer reached 100%. Only 35 volunteers (33%) were clearly better than chance; with 45 attempts, that requires at least 64.4% correct answers. For about two thirds of the volunteers, our decoder could not reliably tell left from right.
| Recognized correctly | Participants | Share |
|---|---|---|
| 25 to under 30% | 1 | 0.9% |
| 30 to under 35% | 1 | 0.9% |
| 35 to under 40% | 4 | 3.8% |
| 40 to under 45% | 12 | 11.3% |
| 45 to under 50% | 12 | 11.3% |
| 50 to under 55% | 12 | 11.3% |
| 55 to under 60% | 11 | 10.4% |
| 60 to under 65% | 18 | 17.0% |
| 65 to under 70% | 4 | 3.8% |
| 70 to under 75% | 9 | 8.5% |
| 75 to under 80% | 3 | 2.8% |
| 80 to under 85% | 8 | 7.5% |
| 85 to under 90% | 4 | 3.8% |
| 90 to under 95% | 4 | 3.8% |
| 95 to under 100% | 3 | 2.8% |
Source as for the first table on this page.
Why it is so hard
The result is typical for EEG, not a failure of one method. Several things come together:
- Few examples. A few dozen attempts per person are not much to learn from, but every attempt costs the volunteer time and concentration.
- No training. The volunteers imagined the movements without seeing what the computer made of it. With feedback, many people learn to produce clearer patterns over several sessions.
- The skull. Bone and skin smear the signals of neighboring brain areas together.
- People differ. Some brains produce a strong, easy-to-detect mu rhythm, others hardly any. BCI researchers know this problem well: a part of the users cannot control an EEG system even after training.
This is why EEG-based systems usually decode simple choices, such as left or right, yes or no, or which of several flashing letters a person looks at. Implants record much more detail, which is why the most impressive results, such as decoding attempted speech or handwriting, so far come from implants.
| Method | Where the electrodes are | What they pick up | Effort and risk | Typical use |
|---|---|---|---|---|
| EEG | On the scalp, in a cap | Summed activity of millions of neurons, blurred by the skull | No surgery, quick to set up | Research, sleep and epilepsy diagnostics, simple BCI control |
| ECoG | On the surface of the brain | Activity of smaller areas, sharper and less noisy | Open brain surgery | Planning epilepsy surgery, BCI research |
| Intracortical array | Inside the cortex | Signals of single neurons | Brain surgery, long-term stability still a research topic | Studies restoring movement and speech after paralysis |
How we ran the experiment
We used the EEG Motor Movement/Imagery Dataset from the BCI2000 project, published on PhysioNet: recordings of 109 volunteers, of which we used 106; 3 were recorded at a different sampling rate and left out. From each person, we took the three runs in which they imagined closing the left or the right fist, 64 channels at 160 samples per second. We filtered the signals to 8–30 Hz, cut out the window from 0.5 to 2.5 seconds after each cue and trained common spatial patterns with linear discriminant analysis, separately for each person. For the mu rhythm, we compared the power from 8 to 13 Hz during imagination with the rest periods of the same recordings. All random choices use a fixed seed. The next part turns from brains to chips: what limits the speed of the hardware that runs AI.