

Every AI project gets the same question sooner or later: was it worth it? “The team loves it” and “we save hours every week” rarely survive a budget meeting. Finance wants to know three things: what changed in money terms, what it cost in total and how sure you are that AI caused the change.
This is part 2 of Level 4 in our AI Work learning path. Part 1 placed AI in a company strategy. This part shows how to build a business case that holds up: four kinds of benefit, the full cost, attribution with a comparison group, the ROI formula with a worked example, intangible benefits and a report that finance can check. Our AI Productivity section covers the other side: measuring time and quality for your own tasks.
ROI, net benefit and payback
Return on investment (ROI) compares the net benefit of an investment with its cost:
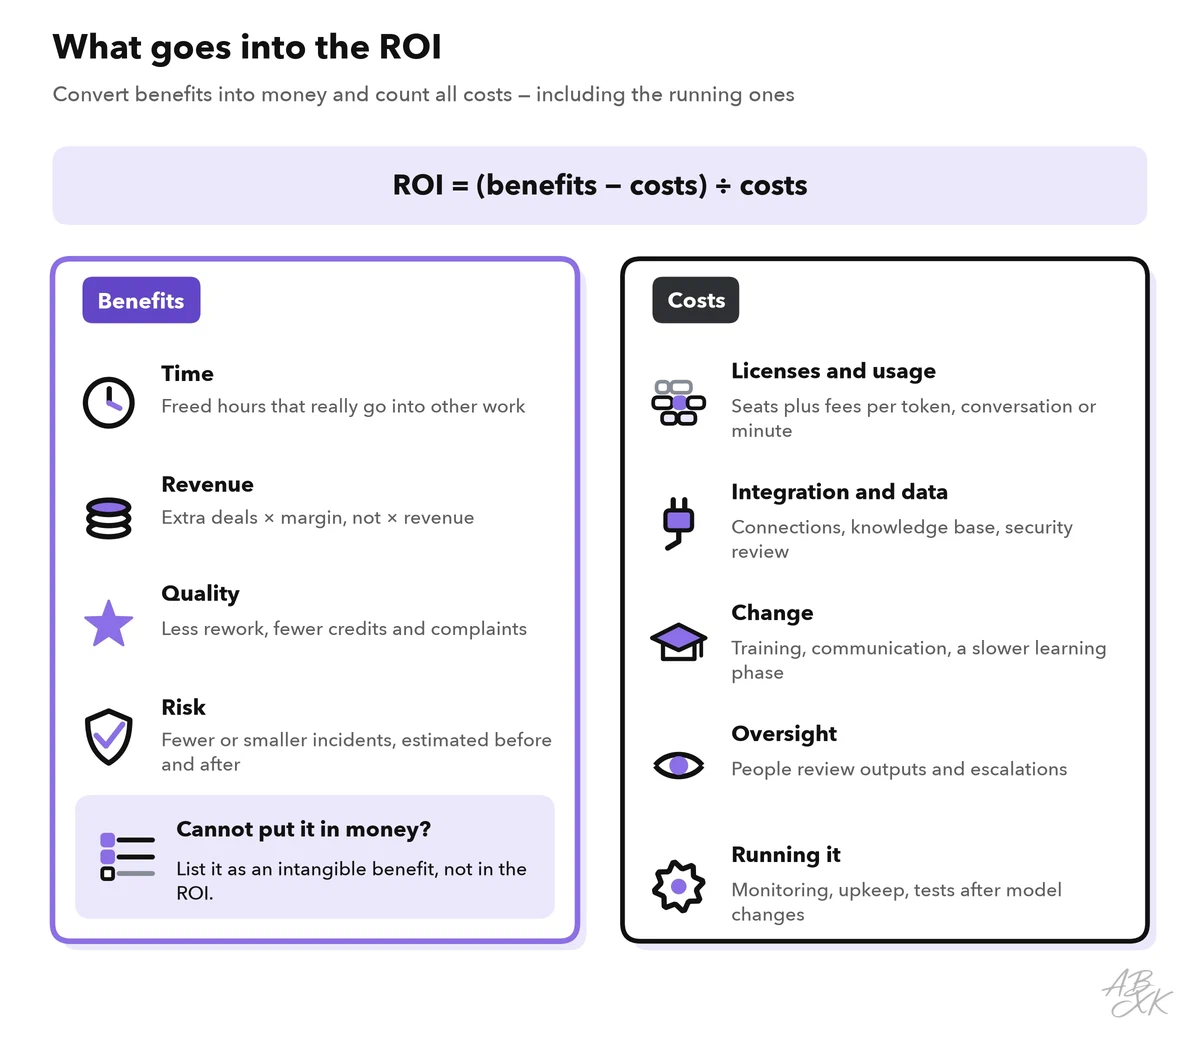
ROI = (benefits − costs) ÷ costs
An ROI of 50 percent means that each dollar spent came back, plus 50 cents, over the period you looked at. Two more numbers complete the picture. The net benefit is benefits minus costs, in money. The payback period is the time until the cumulative benefits cover the cumulative costs.
The formula is simple. The inputs are hard. Three questions decide whether your result is credible:
- Did you convert all benefits into money, or did you only count hours?
- Did you count all costs, including the people who check what the AI produces?
- Can you show that AI caused the change — not a new colleague, a quiet season or a new help page?
Turn benefits into money
AI creates value in four ways. Each one needs its own conversion into money:
| Benefit | Example | How to put it in money | Common trap |
|---|---|---|---|
| Time | Two minutes less per support ticket | Freed hours × loaded cost per hour × share of time that really goes into other work | Counting every freed hour as saved money |
| Revenue | More leads contacted within an hour | Extra deals × contribution margin | Counting revenue instead of margin |
| Quality | Fewer wrong answers to customers | Avoided rework, credits or complaints × cost per case | Judging quality by gut feeling |
| Risk | Fewer missed deadlines or data errors | Expected loss before minus expected loss after (probability × impact) | Inventing probabilities to make the case work |
The loaded cost per hour is the full internal cost of an hour of work: salary plus social security contributions, benefits and overhead. Your finance team usually has a standard rate for it.
Time is the trickiest benefit. A freed hour is capacity, not cash. It only becomes money when something changes: less overtime, fewer temporary staff, no new hire despite growing volume, or more valuable work done in the same time. The share of freed time that turns into such value is the realization rate. If nobody can say where the freed hours go, count a low rate or none at all.
Count the full cost
Costs are easy to underestimate, because some of them never appear on an invoice. Five groups belong in every AI business case:
- Licenses and usage: seats, plus usage-based fees per token, conversation or minute. Usage fees grow with volume, so model them with the volume you expect, not with the pilot volume.
- Integration and data: connecting the tool to the CRM or help desk, building and cleaning the knowledge base, and the security and data protection review.
- Change: training, communication, the time of champions and a learning phase in which teams work more slowly.
- Oversight: people who review AI outputs, check samples and handle escalations. This cost lasts as long as the AI runs.
- Running it: monitoring, updating prompts and knowledge, re-testing after model updates and managing the vendor.
Separate one-time costs from running costs. Year 1 carries both, later years only the running costs. Oversight is easy to forget, because it hides in other people’s working time. Level 3 shows where human checks belong and how to size them: human in the loop: quality control and escalation.
One cost hides even better: rework by the people who receive AI output. When a colleague passes on a polished but empty draft, someone else has to ask questions, fix it or redo it. In a 2025 survey by BetterUp Labs and the Stanford Social Media Lab, each such case of “workslop” cost almost two hours. The researchers put the lost time at about $186 per month for each affected employee, or more than $9 million a year for a company with 10,000 staff (Source: reported by Fortune, September 2025). A business case that counts only the minutes the sender saves can show a profit while the team as a whole loses time. Ask the receivers, too.
Attribution: show that AI caused the change
Attribution means showing which part of a change comes from AI. A simple before-and-after comparison is weak. Seasons, staffing, price changes, product launches and new help pages all move the same numbers. Three designs, from weakest to strongest:
- Before and after in one team. Acceptable only with a long and stable baseline.
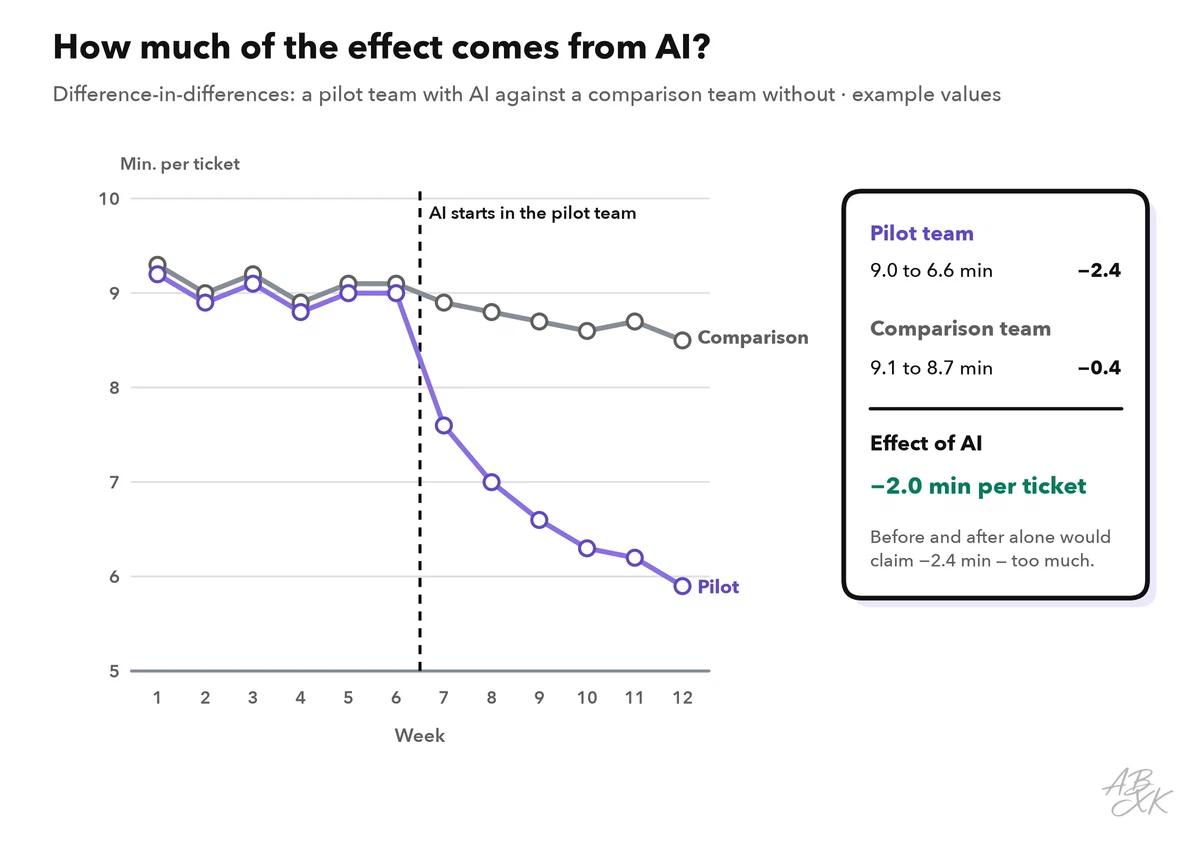
- Comparison group. A similar team without AI over the same weeks. You compare the change in both teams. This design is called difference-in-differences.
- Randomized rollout. You assign agents, tickets or regions to AI or no AI by chance, as in an A/B test. This is the strongest design, because chance spreads hidden differences evenly.
The figure shows difference-in-differences with example values. The pilot team got faster by 2.4 minutes per ticket. But the comparison team also got faster without AI, by 0.4 minutes. Only the difference, 2.0 minutes, can be credited to AI.
Set up the comparison before the pilot starts, together with the baseline. Level 3 explains how to run an AI pilot project with a baseline and clear success criteria.
A worked example with invented numbers
Here is a full calculation. All numbers are invented to show the method. They do not describe a real company or product.
A support team handles 90,000 tickets a year. An AI assistant drafts replies in the help desk, and agents check and send them. The pilot showed 2.0 minutes less per ticket that can be credited to AI. The loaded cost is $45 per hour. The team lead estimates that 60 percent of the freed time goes into valuable work: the team absorbs growing volume without a new hire and calls customers back sooner. Fewer wrong answers also mean fewer goodwill credits. Setup and the learning phase take three months, in which no benefit is counted.
| Line | Calculation (example values) | Year 1 | Year 2 |
|---|---|---|---|
| Time freed | 90,000 tickets × 2 min = 3,000 hours per full year | 2,250 h | 3,000 h |
| Benefit: time | 60% of the freed hours × $45 | $60,750 | $81,000 |
| Benefit: quality | Fewer goodwill credits | $6,000 | $8,000 |
| Total benefits | Year 1 counts 9 of 12 months | $66,750 | $89,000 |
| One-time costs | Integration, knowledge base, training | $27,000 | – |
| Licenses and usage | Seats and usage fees | $24,000 | $24,000 |
| Oversight | Team lead checks samples: 5 h a week × 48 weeks × $50 | $12,000 | $12,000 |
| Running it | Monitoring, upkeep, re-tests | $6,000 | $6,000 |
| Total costs | $69,000 | $42,000 | |
| Net benefit | Benefits − costs | −$2,250 | $47,000 |
| ROI | Net benefit ÷ costs | −3% | 112% |
The first year almost breaks even, and the second one is clearly positive. Over two years, the project returns a net benefit of $44,750 on $111,000 of cost — an ROI of 40 percent. The figure shows the same calculation month by month:
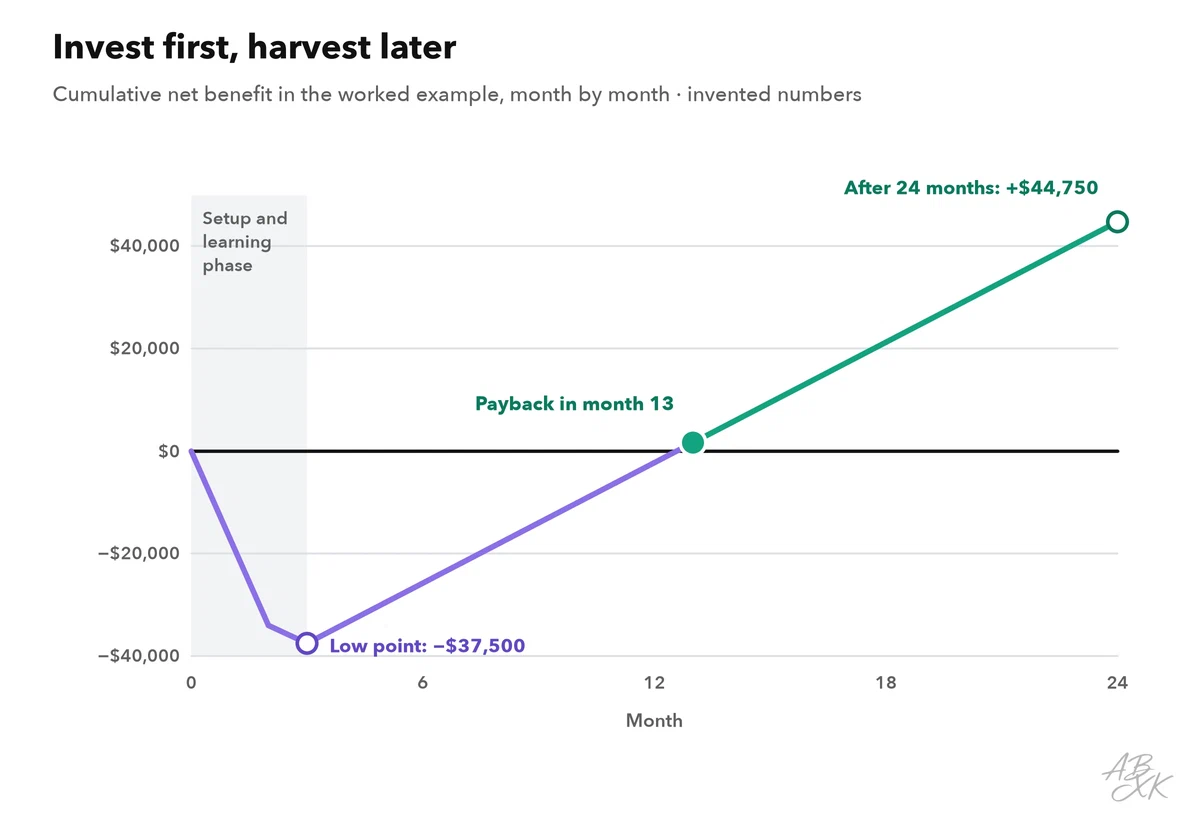
This J-shaped curve is typical. Setup, training and the learning phase cost money before any benefit arrives. The economists Erik Brynjolfsson, Daniel Rock and Chad Syverson describe a similar pattern for whole economies. They call it the productivity J-curve: companies first invest in intangible assets such as new processes and skills, and the measurable gains come later (Source: Brynjolfsson, Rock and Syverson, “The Productivity J-Curve”, American Economic Journal: Macroeconomics, 2021, aeaweb.org). Judge an AI investment over two to three years, not over its first quarter.
Tools for this kind of use case appear in our comparison. According to the vendors, Tidio combines an AI agent with live chat and ticketing, Typewise offers AI agents for enterprise customer service, and SleekFlow brings messaging channels into one inbox with AI assistance. The numbers above are invented and describe none of these products:



Short descriptions from our tool comparison, based on the vendors' information — not tested by ABXK.
Test how robust the result is
A single ROI number suggests more precision than you have. Some inputs are measured, such as the minutes per ticket. Others are estimates, such as the realization rate. A sensitivity analysis shows how far the result moves when one assumption changes and all others stay the same.
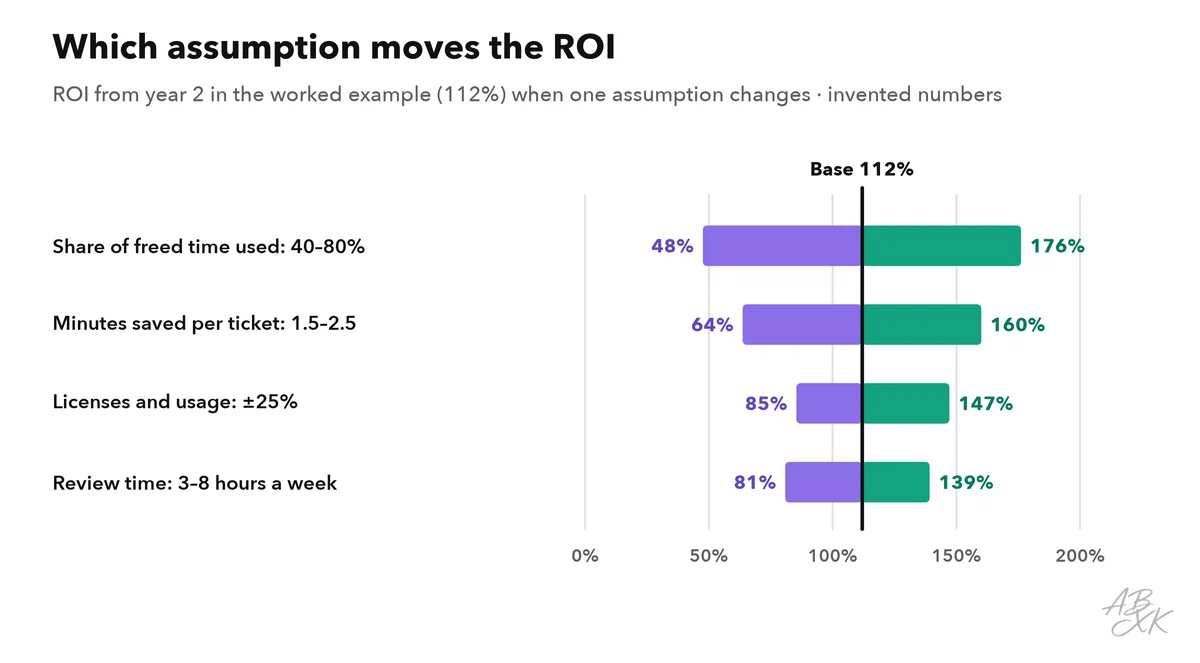
In the example, the realization rate moves the result most. Between 40 and 80 percent, the ROI from year 2 ranges from 48 to 176 percent. It is also the assumption that is hardest to check. So report a range, name the assumption that drives it and agree with finance how you will verify it, for example with overtime hours or hiring plans.
Name intangible benefits, but keep them out of the number
Some benefits are real but hard to put in money:
- Employee experience: less repetitive work, which can lower turnover.
- Speed: faster answers or offers that customers notice.
- Learning: skills and data foundations that make the next use case cheaper.
- Option value: a platform that enables later use cases.
There are intangible costs too: dependency on one vendor, skills that fade when people stop doing a task themselves, and the damage that a visible AI error does to trust.
List these next to the ROI, each with an indicator: an employee survey, response times, the number of use cases on the same platform. But keep them out of the ROI number. A business case that needs intangible benefits to break even is a weak business case. How well people really use the tool decides how much of the planned benefit appears at all. Part 4 covers AI adoption and change management.
Report the result so that finance can check it
Write one page per use case and update it every quarter. Compare the realized benefits with the planned ones. That comparison keeps the next business case honest, and it shows that you still track the numbers after the money is spent.
| Section | Content |
|---|---|
| Baseline | Metric, period and value before AI |
| Method | Comparison group or randomized rollout, number of cases |
| Measured effect | Change credited to AI, with a range |
| Benefits | Per type, in money, with the realization rate |
| Costs | One-time and running, including oversight |
| Result | Net benefit, ROI, payback, sensitivity |
| Intangibles and risks | Indicators, incidents, open risks |
| Decision | Continue, scale, change or stop |
Before you send the page, check it against six common mistakes that distort an AI business case:
| Mistake | Effect | Better |
|---|---|---|
| Freed hours counted as money | ROI far too high | Apply a realization rate and say where the time goes |
| Oversight left out | Costs too low for as long as the AI runs | Count review time as a running cost |
| Before and after only | Season or staffing changes credited to AI | Use a comparison group or randomize |
| Measuring during the learning phase | AI looks worse than it is | Report the learning phase separately, judge over two to three years |
| Revenue instead of margin | Benefit inflated | Use contribution margin |
| One number, no range | False precision | Report a range and the assumption that drives it |