

Most lists of AI trends are predictions. This page shows the trends you can measure, with charts built from the data behind our site: the benchmark archive of Epoch AI that feeds our LLM database, company spending data from Ramp that we track in the tool comparison, and recent studies. The charts are rebuilt every time the data is updated, so the trends here move with the field.
Each section ends with what the trend means for work, because a trend is only useful if it changes a decision.
Trend 1: Capability keeps rising, and open models follow closely
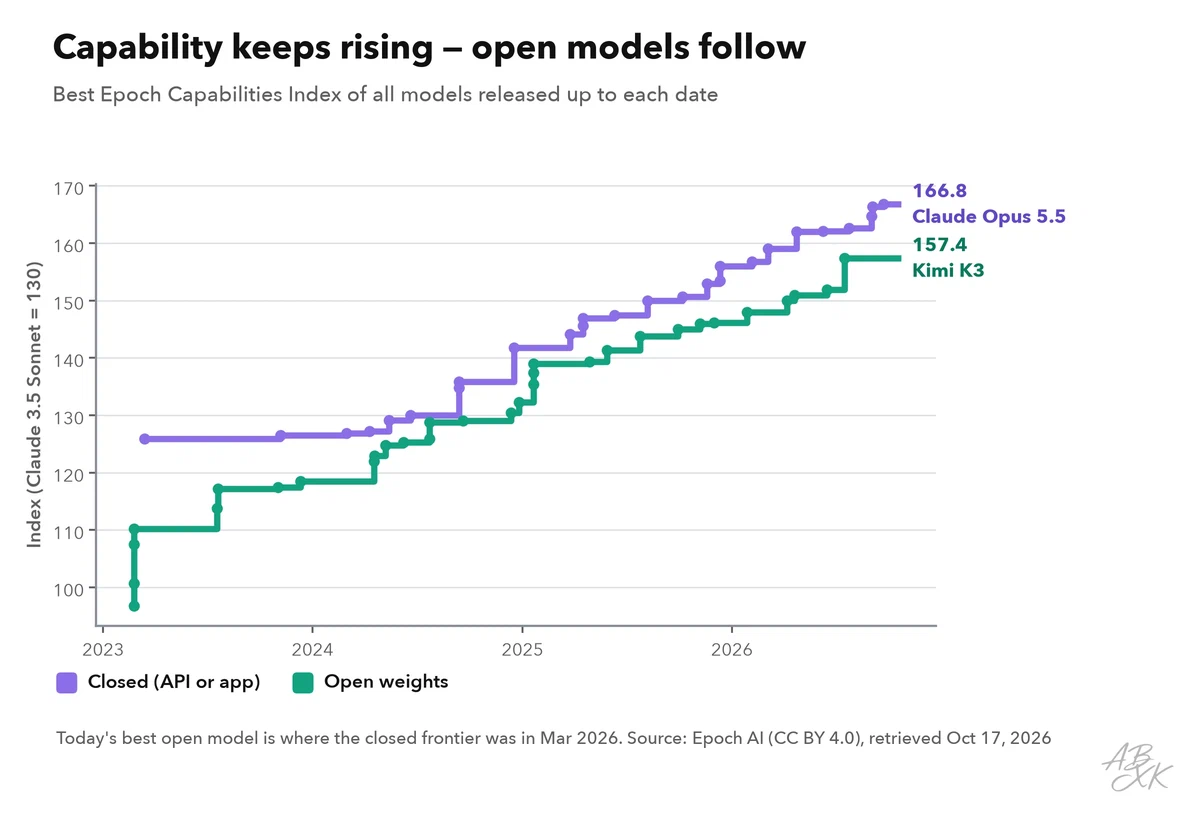
The Epoch Capabilities Index combines the results of many benchmarks into one scale, so models from different years can be compared. Two lines matter: the best closed model, which you can only use through an app or an API, and the best model with open weights, which anyone can download and run. Both climb steadily, and the open line follows the closed one with a delay of a few months; the exact gap is printed below the chart. Of the 343 models in our LLM database, 172 have open weights.
The race between countries has narrowed in the same way. According to the Stanford AI Index 2026, the performance gap between the best US and Chinese models “has effectively closed”: in March 2026, Anthropic’s top model led by just 2.7% (Source: Stanford HAI, AI Index Report 2026, hai.stanford.edu).
What it means for work: a model that runs on your own servers now does what the best paid model did a few months ago. If data protection or costs kept you from using AI on sensitive documents, check open models again. And plan for change: the best model for a task today will not be the best in half a year, so keep prompts, tests and data independent of one provider.
Trend 2: Two countries build most models
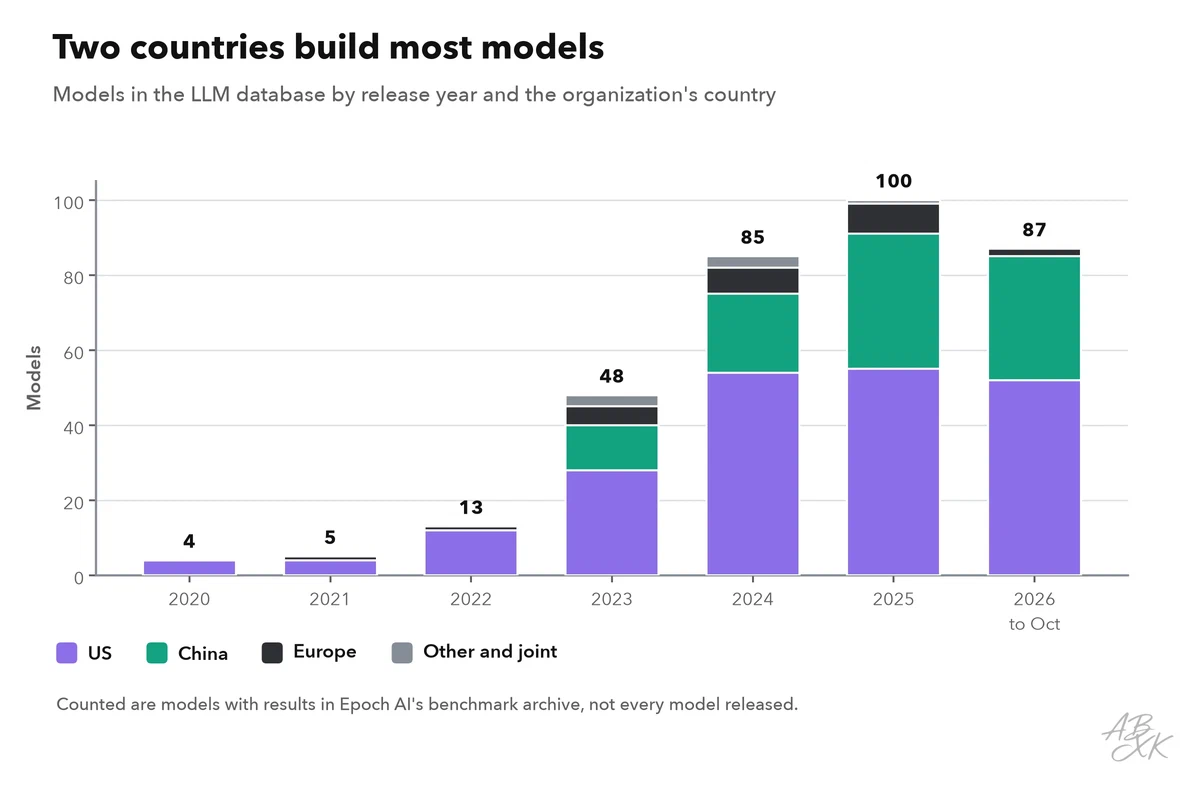
Almost every model in our database comes from an organization in the United States or China, and China’s share has grown since 2023. Europe contributes a small number, most of them from France. The chart counts models that have benchmark results in Epoch AI’s archive, which favors well-known models; it is a picture of the frontier, not a census of every model released.
The Stanford AI Index 2026 draws the same line with other data: the US still produces more top-tier models, while China leads in publications, citations and patents, and industry built over 90% of the notable frontier models in 2025 (Source: Stanford HAI, AI Index Report 2026).
What it means for work: where a model comes from decides which laws and which provider terms apply to your data. Before you adopt a tool, check who builds the model behind it and where your data is processed; our ground rules for using AI at work include the questions to ask.
Trend 3: AI agents handle longer tasks
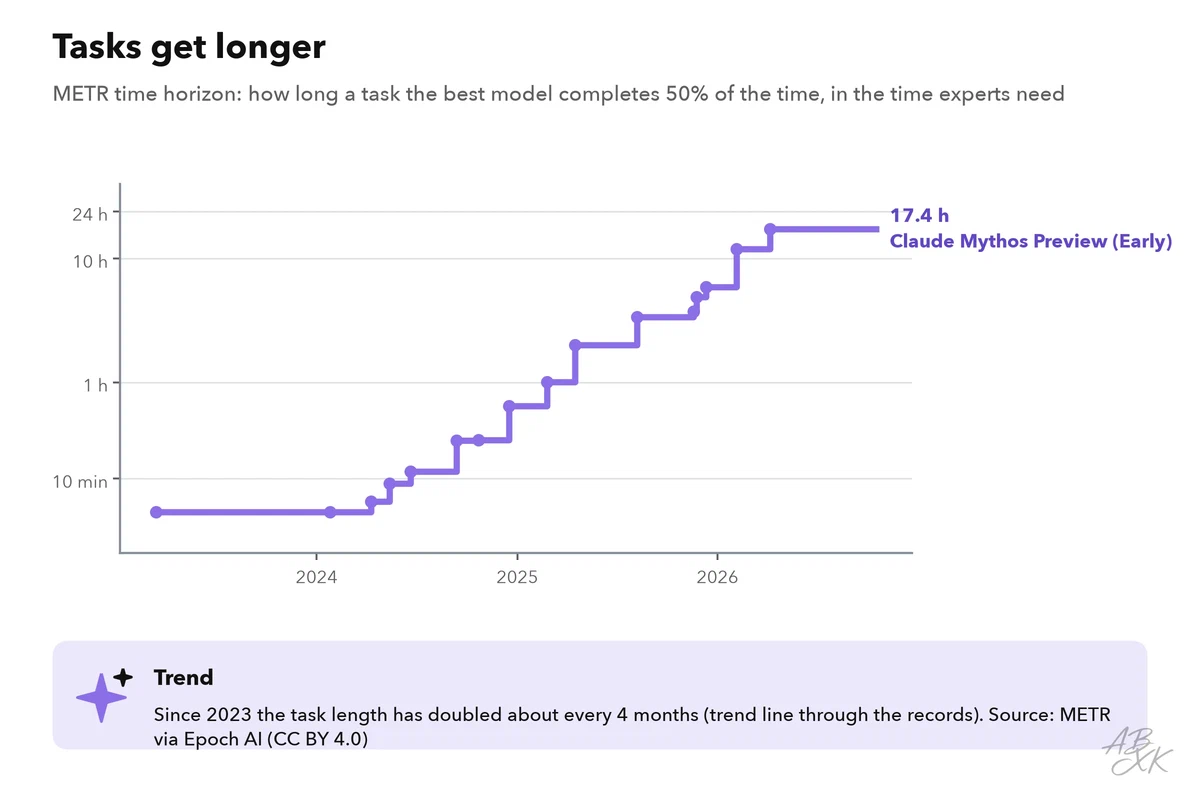
METR, a research group that evaluates AI systems, measures the length of tasks that an AI agent completes half of the time, counted in the time a human expert needs for the same task. The record has grown from a few minutes in 2023 to many hours; the trend line shows how many months it takes to double. Benchmarks with a fixed maximum, such as exam questions, are used up within a few years. This one has no ceiling, which is why it shows the trend best.
What it means for work: agents can now take on tasks that fill half a working day, such as preparing a market overview or fixing a bug across several files. But the measure counts tasks that succeed half of the time, so the other half fail. Long agent tasks need checkpoints and a person who reviews the result; human in the loop shows how to set them up.
Trend 4: Companies pay for specific AI tools
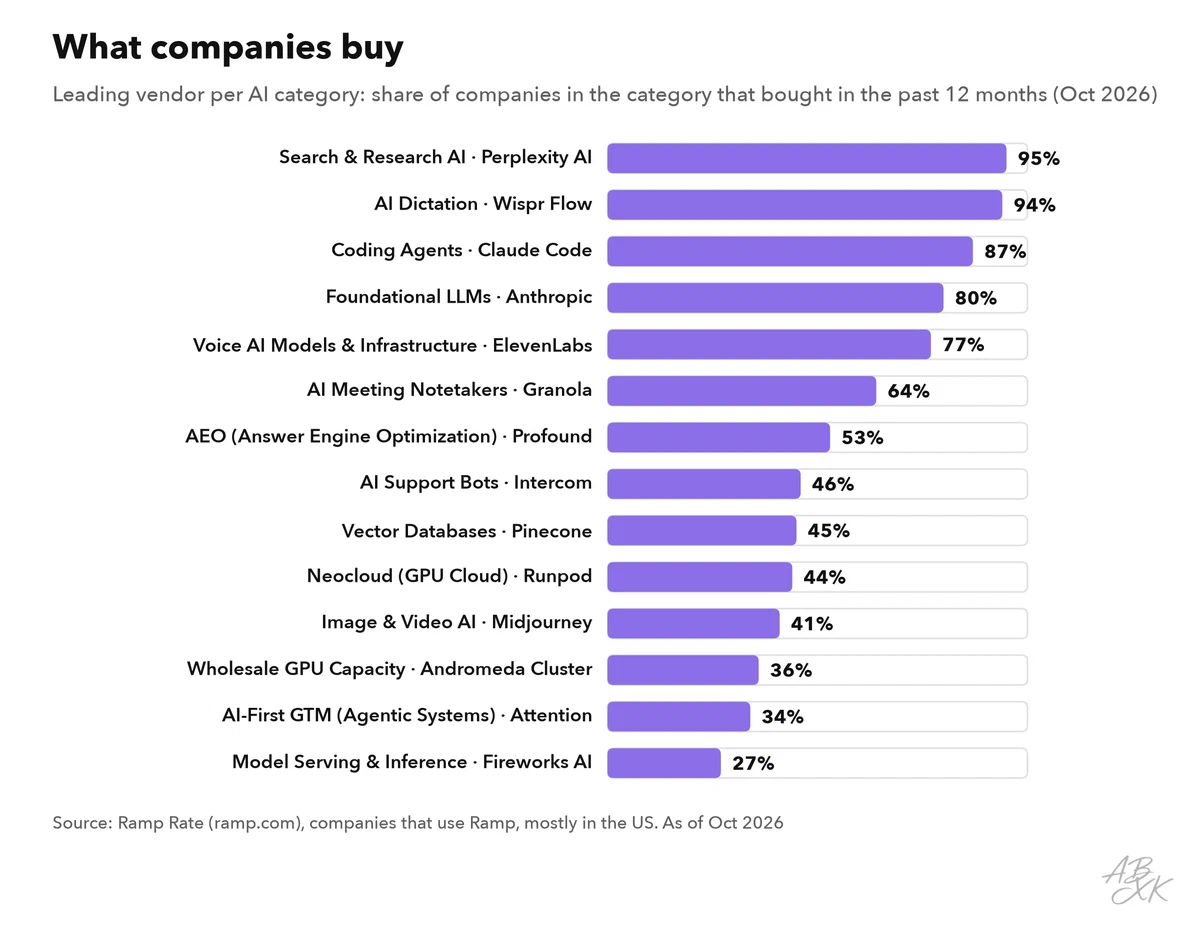
Spending data shows which tools companies actually pay for, not just which ones people talk about. In several AI categories, one vendor reaches almost every company that buys in the category, while other categories are still open races. Our tool comparison shows the full table and will show changes from month to month. The Stanford AI Index 2026 reports that organizational adoption of AI reached 88% (Source: Stanford HAI, AI Index Report 2026).
What it means for work: when most companies use AI, the difference lies in how well they use it. Measure what a tool changes before you roll it out widely; measure the ROI of AI at work explains how.
Trend 5: More use, more incidents
The more AI is used, the more often it goes wrong in public. The Stanford AI Index 2026 counts 362 documented AI incidents in 2025, up from 233 in 2024 (Source: Stanford HAI, AI Index Report 2026). These range from chatbots that give customers false information to deepfakes used for fraud.
What it means for work: clear rules and quality checks are not red tape, they are what keeps a company out of that list. Our AI Security section covers the risks in detail, and what AI changes at work puts the gains in perspective.
How this page stays current
| Trend | Data | Source | Updated |
|---|---|---|---|
| Capability, open vs. closed | Epoch Capabilities Index of all models | Epoch AI benchmark archive (CC BY 4.0) | Weekly |
| Countries | Models by release year and country | Epoch AI benchmark archive | Weekly |
| Task length | METR time horizon records | METR via Epoch AI | Weekly |
| What companies buy | Leading vendor per AI category | Ramp Rate (ramp.com) | Monthly |
| Adoption, incidents, US vs. China | Survey and incident counts | Stanford AI Index 2026 (hai.stanford.edu) | Yearly |
All values in the charts are calculated from these data sets when the page is built; none is typed in by hand. We do not test models or tools ourselves.