

Most people judge AI tools by feel. “It saves me a lot of time” is the usual verdict, and it is often wrong. In a 2025 study by the research group METR, experienced software developers expected AI to make them faster. The measurement showed they were slower — and afterward they still believed the AI had helped. If you want to know whether AI really pays off in your work, or if you need to convince a manager, you need numbers you can defend.
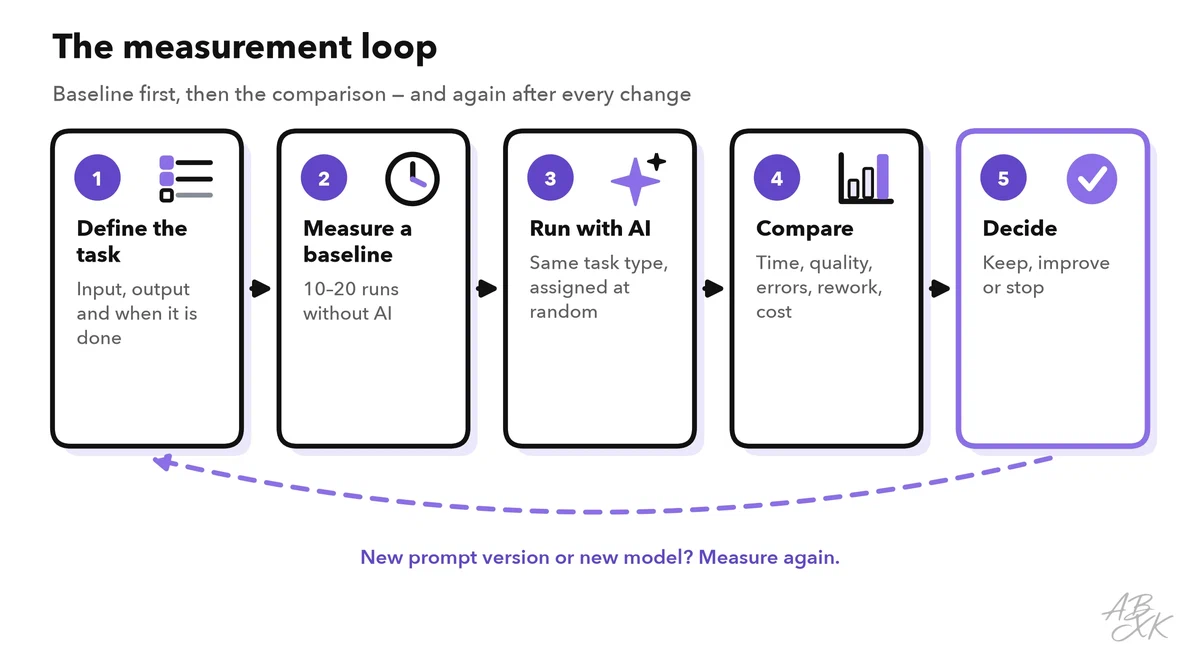
This is part 1 of Level 4, the expert level of our AI Productivity path. In Level 0 you asked three quick questions after each try with AI (what AI can do for your everyday work). Here you turn that habit into a method: a clear unit of work, a baseline, five metrics, a fair comparison and a log you can copy into a spreadsheet.
Measure tasks, not “productivity”
“Productivity” is too vague to measure. A task is something you can count: it repeats, it has a clear start and end, and it produces an output someone can check. “Write better” is not a task. “First reply to a customer complaint” is.
Write each task down in one line: input, output and when it counts as done. For example: “Input: meeting recording. Output: summary with decisions and action items. Done: sent to all participants.” Keep different task types apart. A two-line email and a ten-page report do not belong in the same average.
Then measure a baseline: how the task performs today, without AI. Track 10 to 20 instances before you change anything. Sometimes the data already exists — ticket timestamps, document histories or calendar entries. Without a baseline, every later number floats in the air.
Five metrics that tell the full story
Time alone is misleading. AI often makes the first draft faster and the checking slower. Use five metrics together:
| Metric | Definition | How to measure | Common trap |
|---|---|---|---|
| Active time | Minutes you actually work on the task, including prompting, waiting, checking and fixing | Timer or app timestamps, started and stopped per task | Counting only the drafting step |
| Quality | Score on a fixed rubric (see below) | Blind rating by a colleague | Rating your own work when you know which version used AI |
| Error rate | Share of outputs with at least one factual error that reached a reader | Errors found in review plus later complaints | Counting only the errors you noticed yourself |
| Rework | Minutes spent fixing an output, plus outputs rewritten from scratch | Log fix-up time separately | Hiding rework inside “checking” |
| Cost per task | Human time plus tool costs, divided by the tasks that succeeded | Formula below | Ignoring license costs and failed attempts |
Errors deserve their own count because they are expensive later, not now. Level 2 shows how to check AI output for errors in a systematic way.
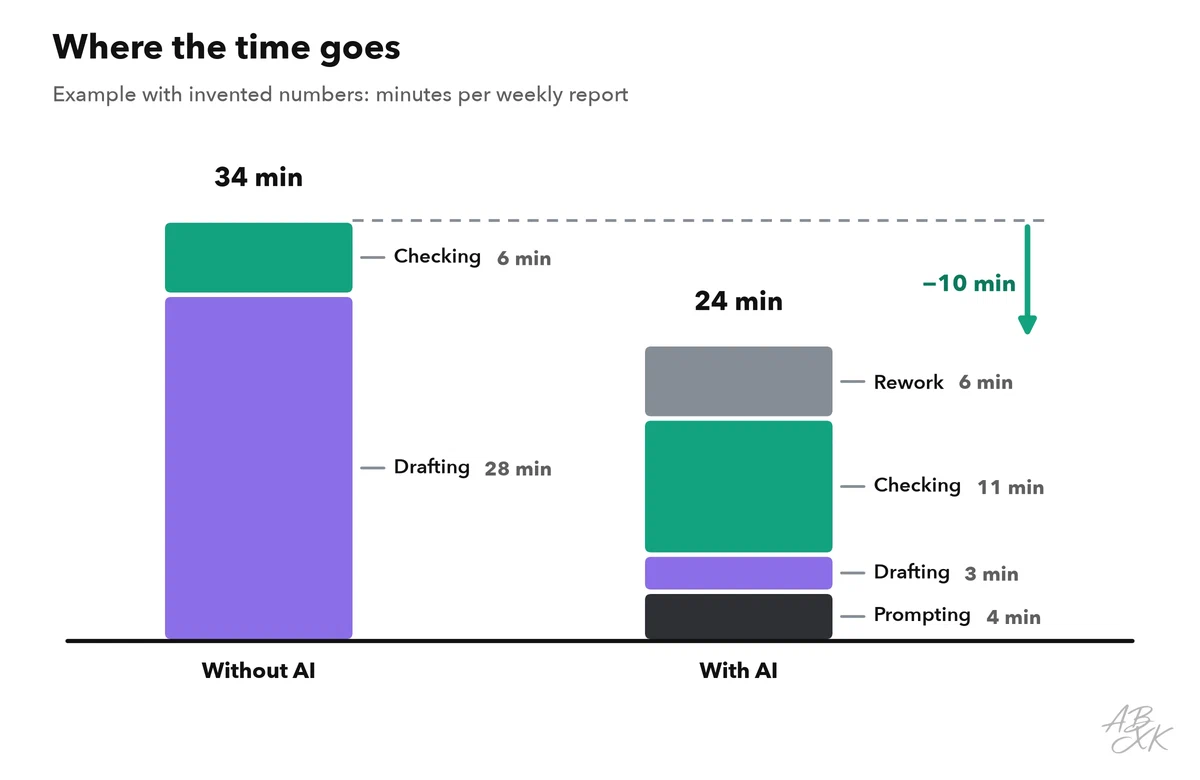
The chart shows why the whole task counts. In this example, AI cuts the drafting time sharply, but checking and rework grow. The net gain is real, but much smaller than the drafting step suggests.
Quality: write the rubric before you see results
A rubric is a short scoring sheet with fixed criteria and clear levels. Write it before you look at any output; otherwise you will adjust the standard to the result. Three to five criteria are enough. Give each level an anchor — a concrete description of what that score means.
| Criterion | 0 points | 1 point | 2 points |
|---|---|---|---|
| Facts | At least one wrong fact | Vague or unchecked detail | All facts correct and checked |
| Completeness | Misses a key point | Covers the main points | Covers everything the reader needs |
| Tone and fit | Wrong tone for the reader | Acceptable, a bit generic | Sounds like your team |
| Ready to use | Needs a rewrite | Needs light edits | Can go out as is |
Rate blind where you can: mix outputs made with and without AI, remove any hint of which is which, and let a colleague score them. Also track the acceptance rate — the share of AI drafts you use after light edits only. A falling acceptance rate is often the first sign that a prompt change or a model update has made things worse. Part 5 of this level shows how to test and evaluate your prompts with the same kind of rubric.
Cost per task: count the failures too
Cost per task puts time and tools into one number. A simple version:
Cost per successful task = (active minutes × cost per minute + AI usage + license share) ÷ success rate
- Cost per minute is your internal hourly cost divided by 60. Your finance or HR team can give you a standard rate.
- AI usage matters for tools that bill per use, for example per token, per image or per minute of video.
- License share is the monthly license fee divided by the number of tasks you do with the tool each month.
- The success rate corrects for failures. If one draft in five is unusable, the real cost of the good ones goes up.
A worked example with invented numbers, counted in minutes only: without AI, a weekly report takes 34 minutes. With AI it takes 24 minutes, but one draft in five is unusable, and you write that report by hand (another 34 minutes). The average with AI is 24 + 0.2 × 34 ≈ 31 minutes. The gain shrinks from 10 minutes to about 3. That is still a gain, but it tells a very different story in a business case.
Compare fairly when you only have a few tasks
You will rarely have hundreds of tasks to compare. With small samples, the setup matters more than the math.
- Randomize. Flip a coin for each task: heads with AI, tails without. Otherwise you will give the AI the easy tasks without noticing — a selection bias.
- Compare like with like. Same task type, similar length, same reviewer.
- Separate the learning phase. The first week with a new tool is slower. Report it separately, or the tool looks worse than it is.
- Watch for the novelty effect. Early enthusiasm makes people try harder with a new tool. Measure for at least two to four weeks.
- Use the median and the range. The median is the middle value when you sort all results. One task that went badly wrong cannot distort it the way it distorts the average.
- Report how many tasks you measured. “Median 24 minutes, n = 12” is honest. “40% faster” without the number of tasks is not.
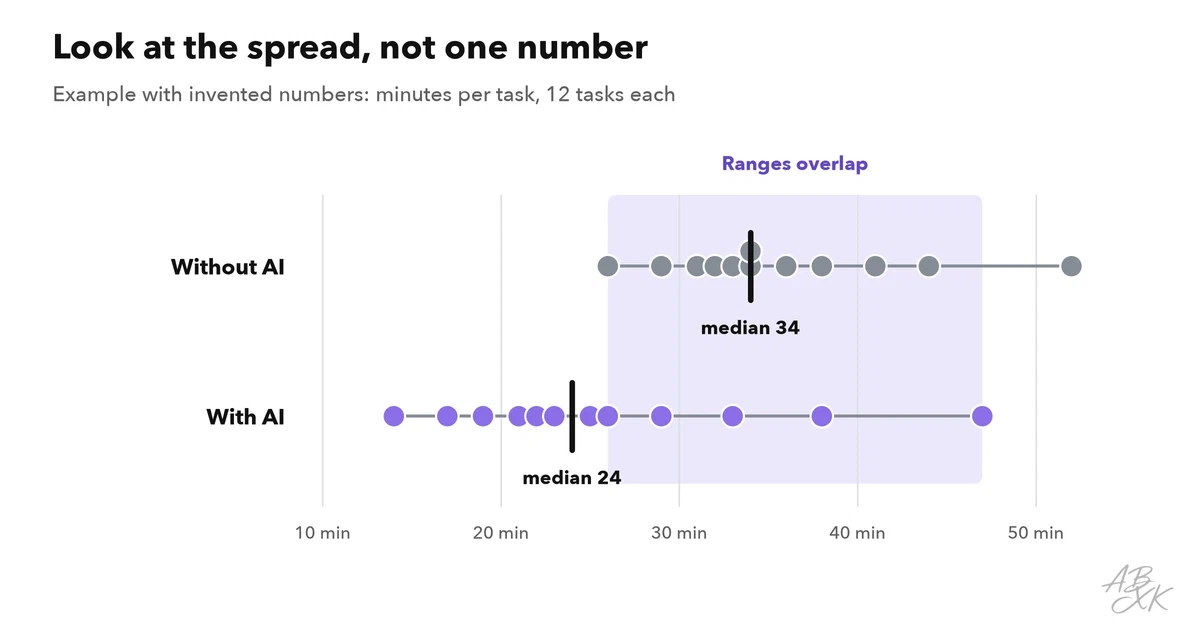
When you report a result, use one line per task type that shows the gain, the price and how sure you can be. With the example values from above: “Weekly report: 12 tasks per group, median 34 → 24 minutes, quality 6.1 → 6.0 of 8 points, reports with errors 1 → 2.” A manager can read that in ten seconds — and see at once that the time gain came with one more faulty report.
What field studies found
Large studies show what is possible. They do not replace your own numbers, because they measured specific tasks, tools and people at a specific time.
| Study | Setting | Result |
|---|---|---|
| Noy and Zhang (MIT), Science, 2023 | 453 college-educated professionals, writing tasks, half of them with ChatGPT | Average time fell by 40%, rated quality rose by 18% |
| Brynjolfsson, Li and Raymond, Quarterly Journal of Economics, 2025 | 5,172 customer support agents with an AI assistant | 15% more issues resolved per hour on average; less experienced agents gained most, the most experienced saw small declines in quality |
| Dell’Acqua et al., Harvard Business School working paper with BCG, 2023 | 758 consultants using GPT-4 | On tasks within the AI’s abilities: 12.2% more tasks, 25.1% faster, over 40% higher quality. On a task outside them, AI users were less likely to reach the correct answer |
| METR, 2025 | 16 experienced open-source developers, 246 real tasks | 19% slower with AI, although they felt faster; METR stresses that this is a snapshot of early-2025 tools |
The authors of the consulting study describe a jagged frontier: AI does very well on some tasks and fails on others that look just as hard. You cannot see the border from the outside. You find it by measuring, one task type at a time.
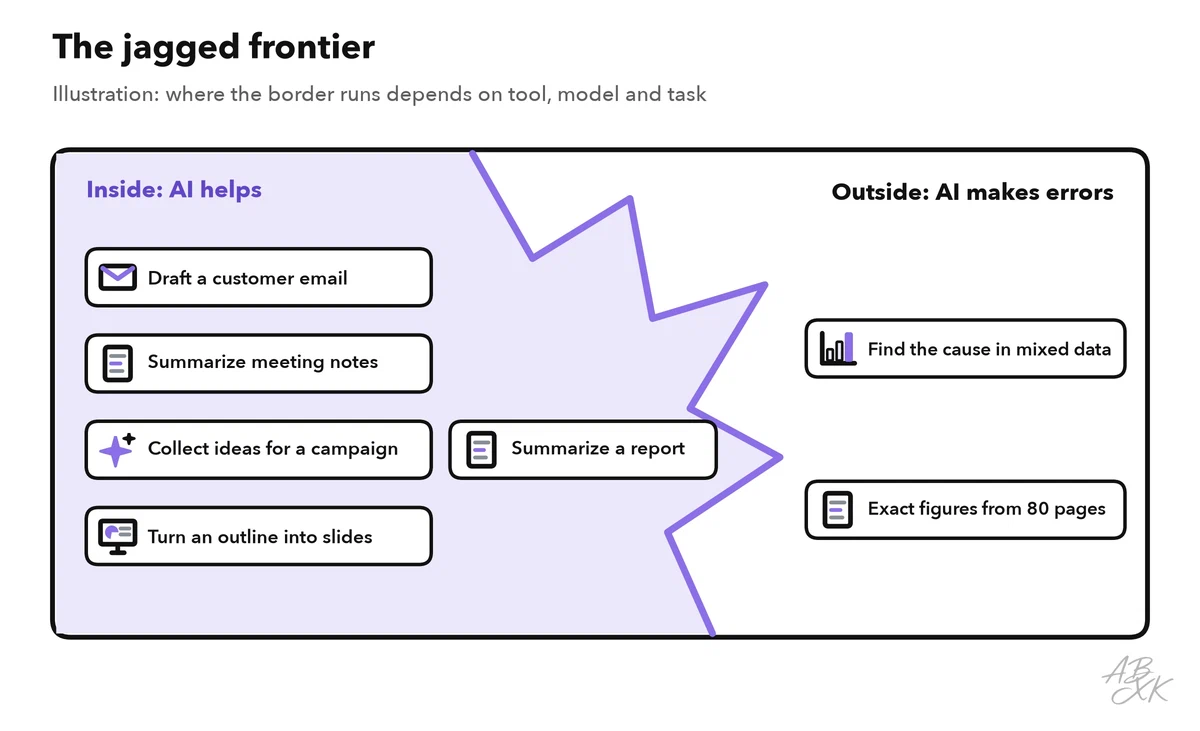
Three lessons follow from these studies. Gains differ by person: less experienced people often gain most. Gains differ by task: outside the frontier, AI can make results worse. And perception is unreliable: only measurement tells you which case you are in.
Two newer findings widen the picture. A 2026 review by the International Labor Organization concludes that productivity gains are real, but often unverified and uneven. The time savings that workers report, a few percent of their working hours, have not yet shown up in measured output, earnings or employment (Source: Merola et al., ILO research brief, June 2026). And time saved by one person can turn into work for another. In a 2025 survey by BetterUp Labs and the Stanford Social Media Lab, 40% of US office workers had received polished but empty AI output, which the researchers call “workslop”, in the past month, and each case took almost two hours to sort out (Source: reported by Fortune, September 2025). So measure at the team level, not only for the person who uses the tool.
Pick the right unit for each type of tool
Different tools need different units of work. Our comparison lists 66 tools for AI Productivity, and vendor claims such as “save ten hours a week” describe someone else’s tasks, not yours. Here is how you could measure four common tool types:
| Tool type | Unit of work | Main metric | Errors to count |
|---|---|---|---|
| Meeting assistant | One meeting summary with action items | Minutes from meeting end to sent summary | Wrong names, owners or numbers |
| Writing assistant | One edited document | Editing minutes per page | Changed meaning, invented facts |
| Presentation maker | One deck ready for review | Minutes to a reviewable deck, plus fix-up time | Wrong charts, generic text |
| AI calendar | One work week | Hours of uninterrupted focus time | Important meetings moved or missed |




Short descriptions from our tool comparison, based on the vendors' information — not tested by ABXK.
A measurement log you can copy
Create one row per task in a spreadsheet, and fill it in right after each task — not at the end of the week. The rows below are an example with invented values; the quality column adds up the four rubric criteria (0–8).
| Date | Task ID | Task type | With AI? | Active min | Rework min | Quality (0–8) | Errors | Used after light edits? |
|---|---|---|---|---|---|---|---|---|
| Oct 6 | R-01 | Weekly report | no | 34 | 0 | 6 | 0 | – |
| Oct 7 | R-02 | Weekly report | yes | 22 | 5 | 6 | 1 | yes |
| Oct 8 | R-03 | Weekly report | yes | 31 | 12 | 5 | 2 | no |
After four weeks, compare the medians per task type. A task that passes becomes a building block for a personal AI workflow. Decide with a simple rule that you write down before you start:
| Result after the learning phase | Decision |
|---|---|
| Time down by at least 20%, quality equal or better, error rate not higher | Keep AI for this task and document the workflow |
| Time down, but quality or error rate worse | Improve the prompt or add a check step, then measure again |
| Time not down | Stop using AI for this task |
| Mixed results with fewer than 10 tasks per group | Keep measuring before you decide |