

Your LLM feature is live. Users ask questions, the model answers, and the bill grows. But does the feature work? Classic monitoring tells you that the server answered with status 200 in under a second. It does not tell you that the answer was wrong, that a prompt change doubled the tokens per request or that a search step found nothing for a whole week. Observability means that you can answer such questions from the data your app records — without guessing.
This is part 5 of Level 3 (Advanced). You will learn what to log for each request, where privacy sets limits and how traces make chains and agents visible. You will also see which numbers belong on a dashboard, which deserve an alert, and how to check quality with samples and notice drift. Evals from Level 2 test a feature before release; observability watches it afterward.
Why classic monitoring is not enough
LLM apps fail in ways that a status code does not show:
- Wrong but successful. A made-up answer arrives with status 200 and normal speed.
- Every request costs something different. Each request has its own token count. A longer prompt or a wordier model raises the bill without a single error.
- Answers vary. The same input can produce different outputs, so one test run proves little.
- The ground moves. A provider updates a model, someone edits a prompt, documents change — and behavior shifts without a new release of your code.
- Many steps, one answer. In a RAG chain or an agent, the final answer depends on several steps. When it is wrong, you need to see which step failed.
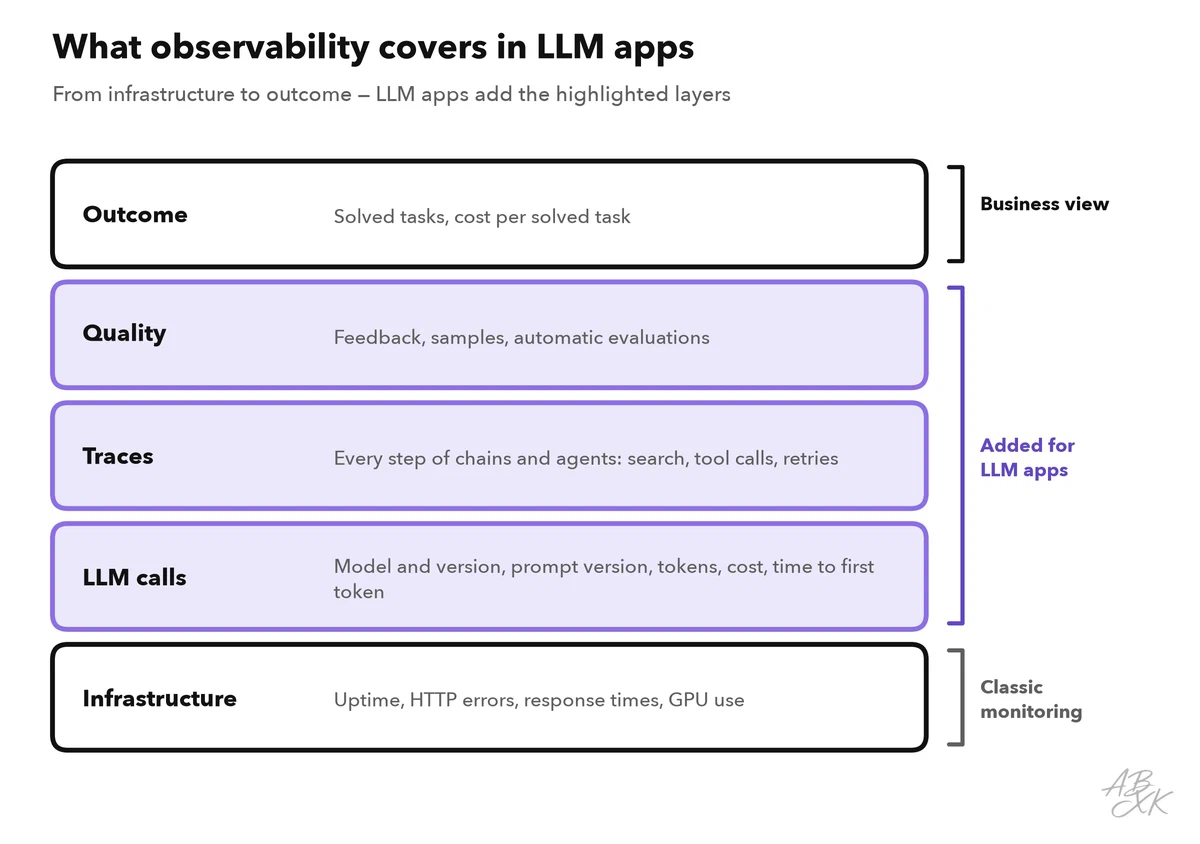
That is why observability for LLM apps has more layers than classic monitoring:
What to log for every request
Give every request a unique ID and record the same fields each time. Structured logs — one JSON object per event instead of free text — make these fields searchable and countable:
{
  "request_id": "req_8f2c41",
  "time": "2026-10-16T09:14:03Z",
  "user": "hash:5e1a9c",
  "prompt_version": "support-v14",
  "model": "provider-model-2026-09",
  "input_tokens": 1850,
  "output_tokens": 240,
  "ms_first_token": 1180,
  "ms_total": 3400,
  "sources": ["kb-112", "kb-087"],
  "feedback": null,
  "error": null
}
The table explains the fields and what they are good for:
| Field | Why you need it |
|---|---|
| Request ID, time | Connect all steps of one request; find a single case quickly |
| Model and version | See which model wrote an answer; compare versions after an update |
| Prompt version | Tie changes in quality to changes in the prompt |
| Input and output text | Debugging and quality review — only redacted, see the next section |
| Input and output tokens | Cost, and how full the context window gets |
| Time to first token, total time | How fast the app feels and how long it really takes |
| Sources | Which documents the search step returned, with their scores |
| Tool calls | Which tools an agent called, with arguments and result status |
| Feedback | Thumbs up or down, comments, corrections by users |
| Errors and retries | Timeouts, rate limits, invalid output that had to be repeated |
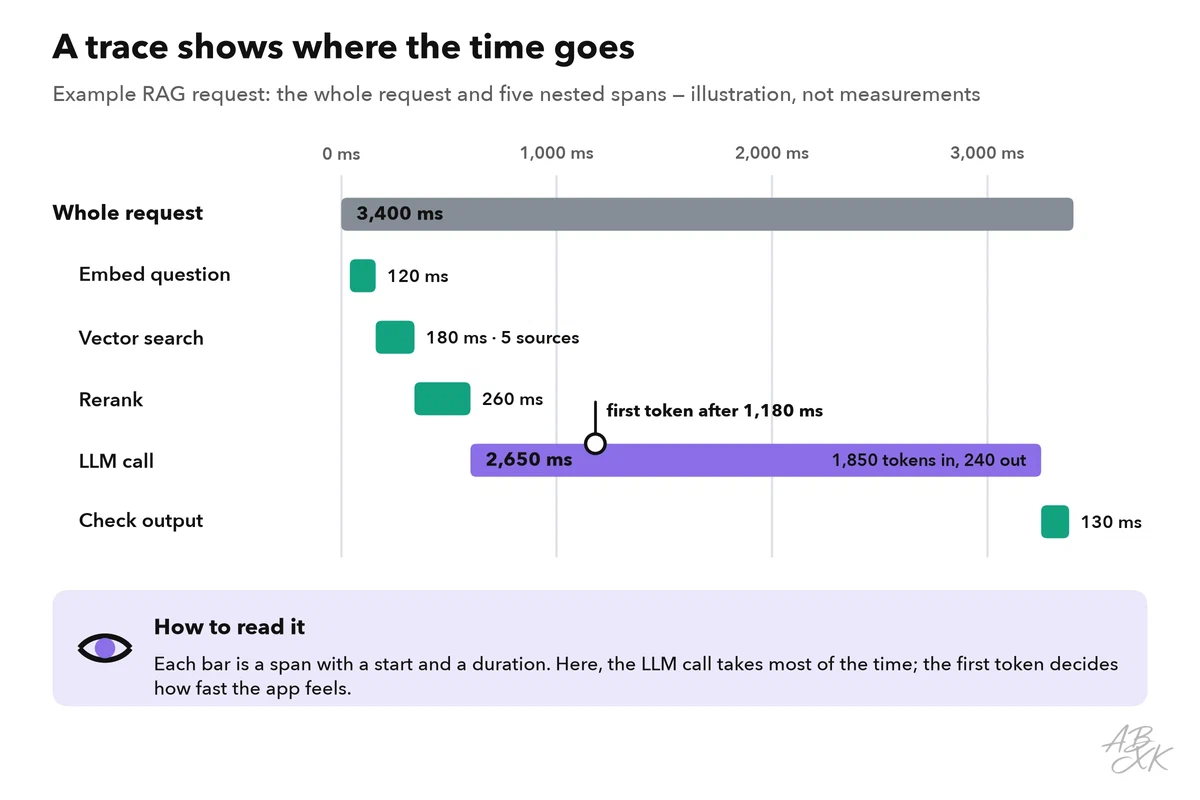
Time to first token is the wait until the first word appears. When the answer is streamed word by word, this number decides how fast the app feels. Compute the cost of each request from its tokens and your provider’s price list, and store it as a number. Then cost per user, per feature and per day is a simple query.
Privacy: log less than you could
Prompts and answers often contain personal data: names, email addresses, order details, sometimes health or financial information. Every log is a copy of that data. The GDPR (General Data Protection Regulation) requires you to limit personal data to what is necessary and to keep it no longer than needed. These are the principles of data minimization and storage limitation in Article 5.
In practice, this means:
- Redact before storing. Replace email addresses, phone numbers, customer numbers and names with placeholders before the text reaches the log. Patterns catch fixed formats; names need more care.
- Pseudonymize users. Store a hashed user ID instead of the name. As long as you can link the hash back to a person, it is still personal data under the GDPR, so the other rules still apply.
- Split access. Everyone on the team may see metrics; only a small group may read full texts.
- Keep texts short, numbers long. For example, delete full texts after 30 days and keep aggregated metrics for a year. Set the actual periods with your data protection officer.
- Never log secrets. API keys, passwords and session tokens do not belong in any log.
If you send logs to an external observability service, the same rules apply there. Check where it stores the data, and mention it in your privacy notice.
Traces: follow one request through every step
A trace records the path of one request through your system. Each step in it is a span: a named piece of work with a start time, a duration and attributes such as the model or the number of retrieved documents. Spans nest: the LLM call sits inside the request, and a tool call sits inside an agent step.
The common open standard for this is OpenTelemetry, a project of the Cloud Native Computing Foundation. It defines how applications record traces, metrics and logs in a vendor-neutral way, so you can switch tools without rewriting your code. OpenTelemetry also defines attribute names for generative AI, such as gen_ai.request.model and gen_ai.usage.input_tokens. This part of the standard is still marked as in development, so check the current names before you build on them.
Traces matter most for agents. When an agent loops, calls the wrong tool or gives up, the trace shows every step with its arguments and results. The failure modes from part 1 of this level become visible instead of hiding behind one final answer.
Dashboards and alerts: the numbers that matter
A dashboard shows trends; an alert calls a person. Keep the dashboard broad and the alerts few. These are the core metrics:
| Area | Metrics | Typical alert |
|---|---|---|
| Reliability | Error rate, timeouts, rate-limit errors (HTTP 429) | Error rate above your limit for several minutes |
| Speed | Time to first token and total time, as p50 and p95 | p95 above your target |
| Cost | Tokens and cost per request, per user and per day | Daily cost above budget; jump in tokens per request |
| Quality | Negative feedback, failed output checks, empty search results | More negative feedback after a release |
| Usage | Requests per hour, conversation length, active users | Sudden drop (broken feature) or spike (possible abuse) |
p95 is the 95th percentile: 95 percent of requests are faster than this value. Averages hide the slow cases that frustrate users, so track percentiles. Alert on what users feel — errors, slowness, wrong answers — and on what hurts the budget. Every alert needs an owner and a link to example traces. An alert that nobody acts on teaches the team to ignore alerts.
Your hosting already covers the bottom layer. Web server and function logs show requests, status codes and errors, whether your app runs on a server managed with a control panel such as Plesk or on a platform such as Netlify. They tell you whether the app was reachable, not whether the answer was right. If you run a model yourself on rented GPUs, also track GPU memory and utilization, as described in part 3 of this level. These three tools come from our comparison of infrastructure tools:



Short descriptions from our tool comparison, based on the vendors' information — not tested by ABXK.
Quality: samples, feedback and drift
User feedback is valuable but thin. Usually only a few users rate answers, and they are not a random sample. Add two more sources of quality data:
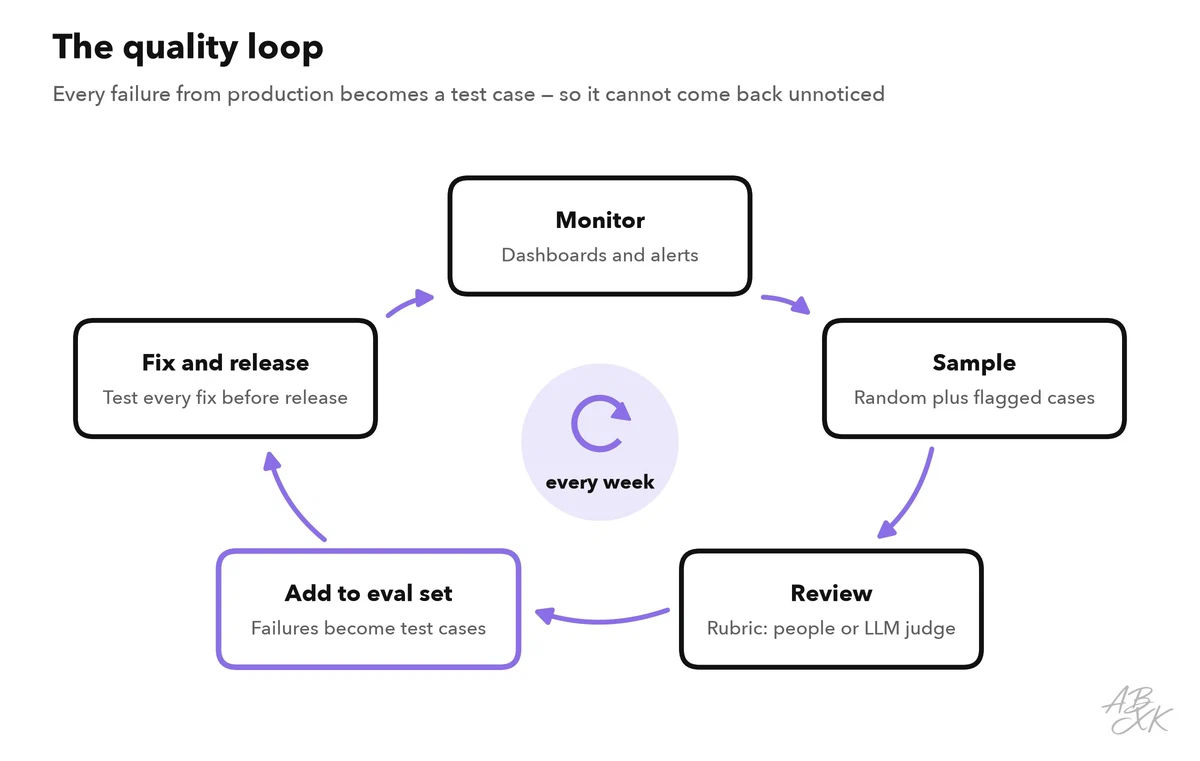
- Random samples. Every week, review a random sample of conversations, for example 50, with a short rubric: correct, complete, based on the sources, right tone.
- Targeted samples. Also review cases with negative feedback, failed output checks, empty search results or unusually long conversations.
For larger volumes, an LLM can score samples with the same rubric. This is called LLM-as-judge. Compare its scores with human ratings on a subset before you rely on it.
Drift means that quality changes over time although nobody changed the feature. It has three usual causes:
- The inputs change: new products, a new customer group, a seasonal topic. Watch the mix of topics and the share of empty search results.
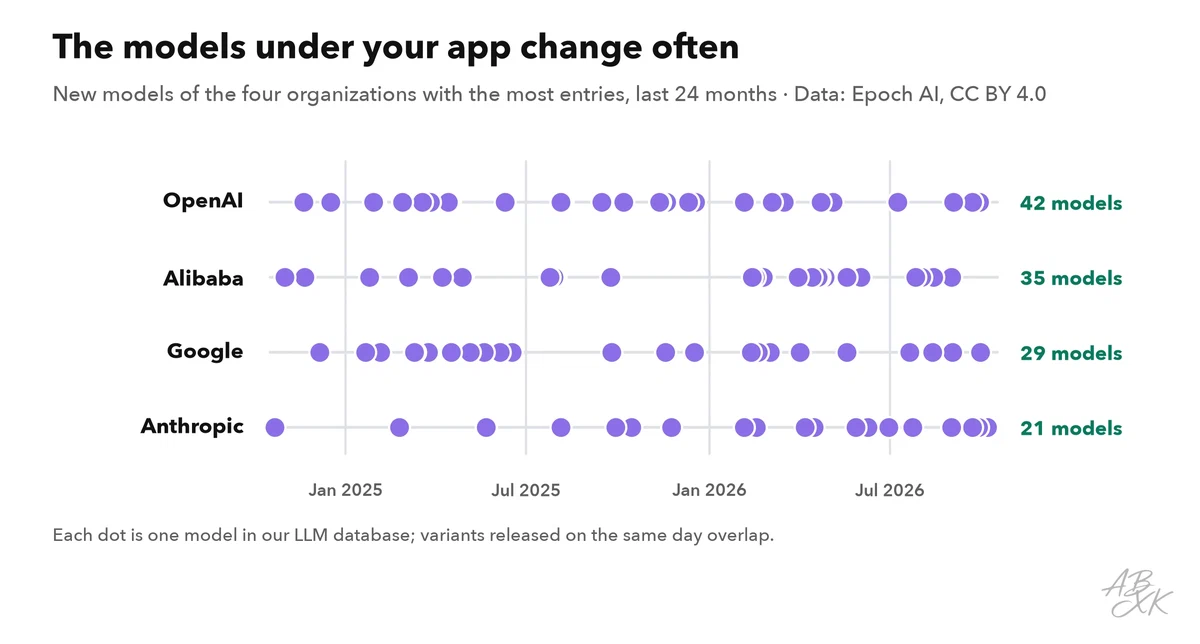
- The model changes: providers release new versions and retire old ones. Pin a model version where the API allows it, and run your evals before every switch.
- Your data changes: documents are added, moved or deleted, and the index follows — or it does not.
The second cause is no rare event. Our LLM database shows how often the organizations behind the big models release new ones:
Every failure you find should end up in your eval set, so it cannot come back unnoticed. That closes the loop between watching and testing:
Setup checklist for your first week
You do not need a large platform to start. These seven steps cover the basics:
- IDs and structured logs for every request, with the fields from the table — and redaction from day one.
- Versions of model and prompt in every log entry.
- Tracing for every step of chains and agents, for example with OpenTelemetry.
- One dashboard with error rate, p95 time, tokens and cost per day, and negative feedback.
- Three alerts: error rate, daily cost and negative feedback.
- A weekly sample with a rubric; failures go into the eval set.
- Retention rules: short for full texts, longer for numbers, documented in your privacy notice.