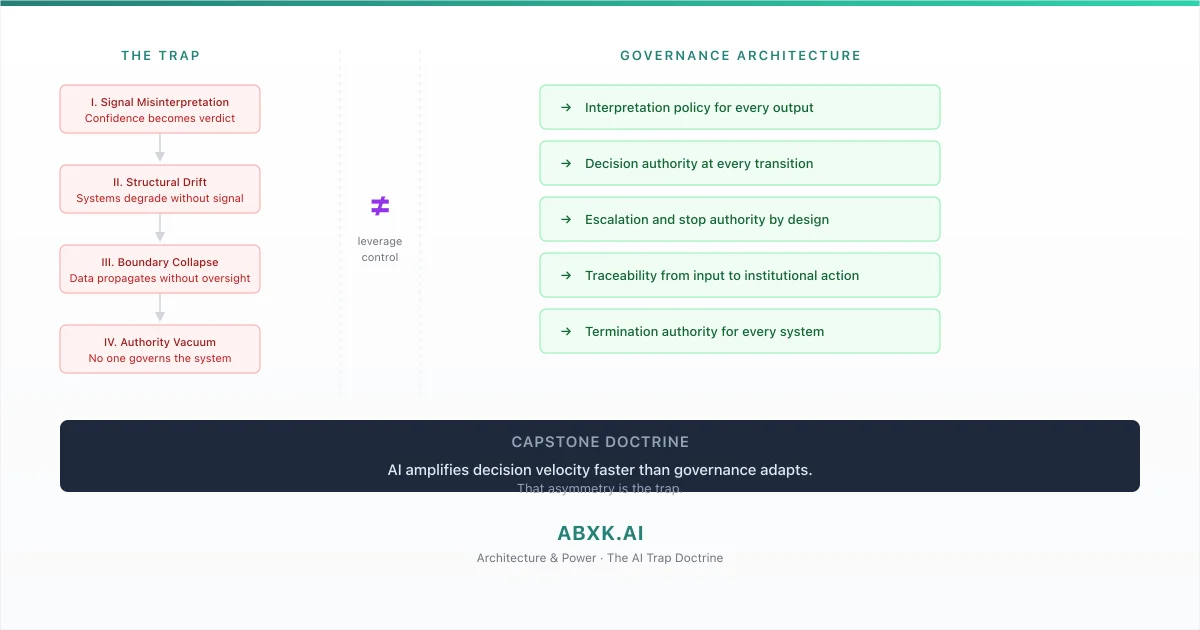
The AI Trap: When Technical Leverage Outpaces Structural Control
AI systems amplify decision velocity faster than governance adapts. Organizations deploy capabilities that exceed their structural capacity to govern — creating …
Architecture frameworks for governing and securing AI systems in enterprise and operational environments.
Built for engineers, architects, and technical leaders responsible for AI, data, and security in production environments.
ABXK frameworks examine how AI systems interact with data flows, security boundaries, and decision authority in production environments.
Map how decisions propagate through AI systems, including escalation paths, approval layers, and control points.
Define who can approve, override, escalate, or stop automated decisions.
Define data boundaries, automation limits, and human override mechanisms across interconnected systems.
Identify structural risks introduced by AI integration, including scale effects, model drift, and fragmented accountability.
Analyze how AI systems expand attack surfaces across data pipelines, enterprise infrastructure, and operational technology (OT) environments.
The goal is not to limit AI, but to ensure it remains governed as it scales.
AI systems amplify decisions and data flows. When governance is unclear or system boundaries are poorly defined, structural risk emerges:
Responsibility diffuses across teams and systems.
Systems expand beyond original intent.
Evaluation criteria erode under pressure.
Rollback and control become difficult.
In production environments, governance must be deliberate.
Structure prevents long-term risk exposure.
ABXK publishes long-form doctrine for professionals responsible for AI, data, and security in production environments.
Applied AI Governance Doctrine
A structured governance framework for AI systems in production environments.
Weak governance scales risk faster than model errors.
Covers:
Built for leaders accountable for AI initiatives in production.
Long-form doctrine · Executive-level framework · Immediate access
Access The AI TrapApplied AI Security Architecture
A structured security architecture framework for AI systems in production environments.
AI systems fail at their boundaries before they fail at their models.
Covers:
Built for security teams and AI architects working with deployed systems.
Long-form doctrine · Architecture framework · Immediate access
Access AI SecuritySecurity Architecture for Operational Technology
A structured security architecture framework for operational technology environments.
AI integration into OT environments expands attack surfaces beyond traditional IT security controls.
Topics include:
Built for engineers and security teams working with operational technology infrastructure.
Long-form doctrine · Architecture framework · Coming soon
Applied research on structural reliability in AI systems operating in production environments.
Research validates and stress-tests the governance architecture against real failure modes.
Detection systems and uncertainty patterns.
Where and why system limits fail.
Exposure patterns in scaled deployments.
Briefings are public excerpts of the doctrine — written for teams operating AI under real accountability.
Each briefing addresses structural weaknesses observed in real deployments.
AI systems amplify decision velocity faster than governance adapts. Organizations deploy capabilities that exceed their structural capacity to govern — creating …
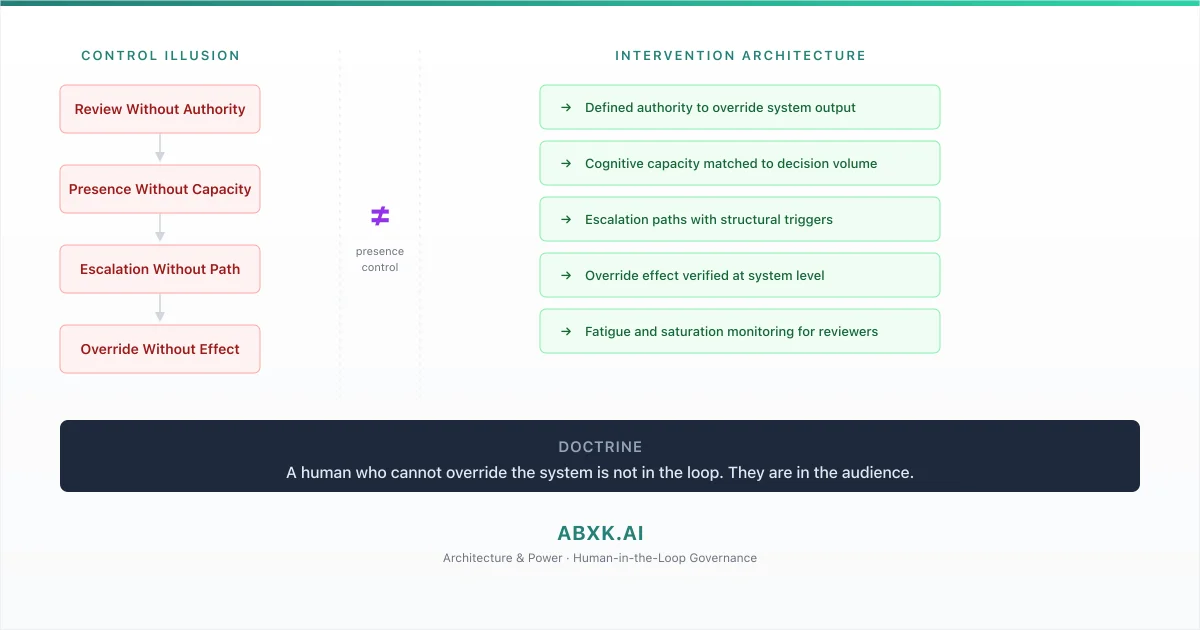
Organizations designate human reviewers as control mechanisms for AI systems — placing people in approval workflows, review queues, and oversight roles. But …
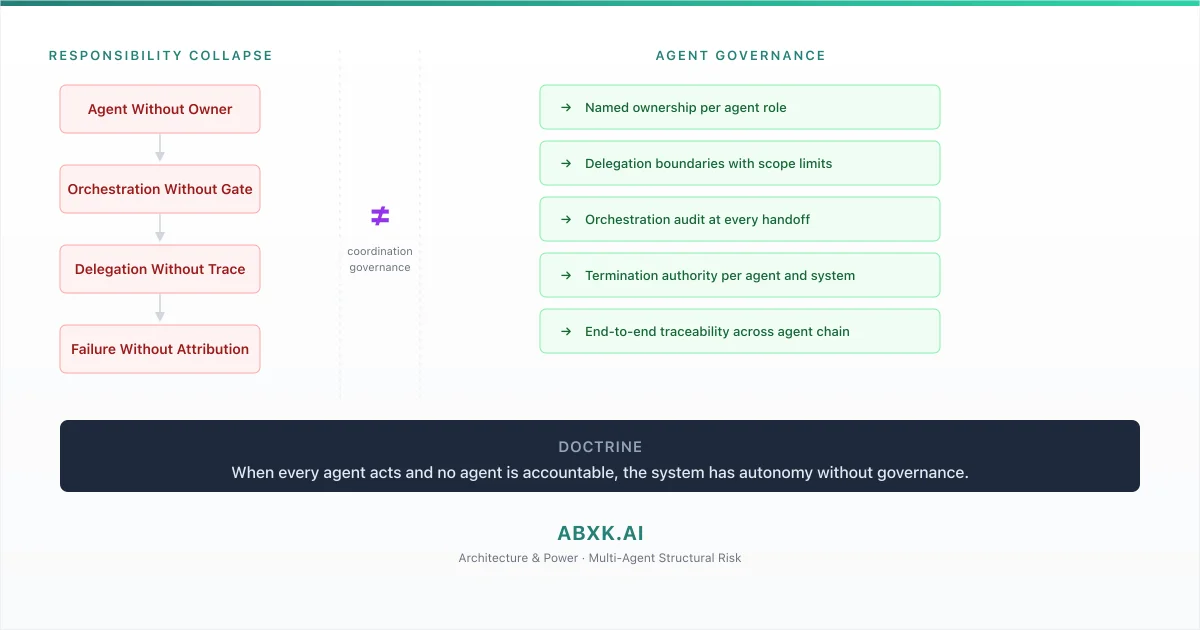
Multi-agent AI systems distribute decision-making across autonomous components that coordinate, delegate, and act without centralized authority. When …
ABXK.AI develops architecture doctrine for AI systems, data governance, and security in production environments.
The work examines how AI systems interact with data flows, security boundaries, and operational infrastructure at scale.
AI creates leverage.
Data expands exposure.
Security defines boundaries.
Governance assigns control.
If you are deploying AI systems in production, governance is not optional.